The return of excitement in Formula One? Maybe a little
The entropy of racing
Formula One racing is often criticized for its lack of excitement compared to previous eras of motorsport. Mercedes has dominated the hybrid era – notching 102 wins or 73% of all races since the 2014 season. The criticism is starting to crack. The excitement of Formula One is on the rise and it is supported by the data.
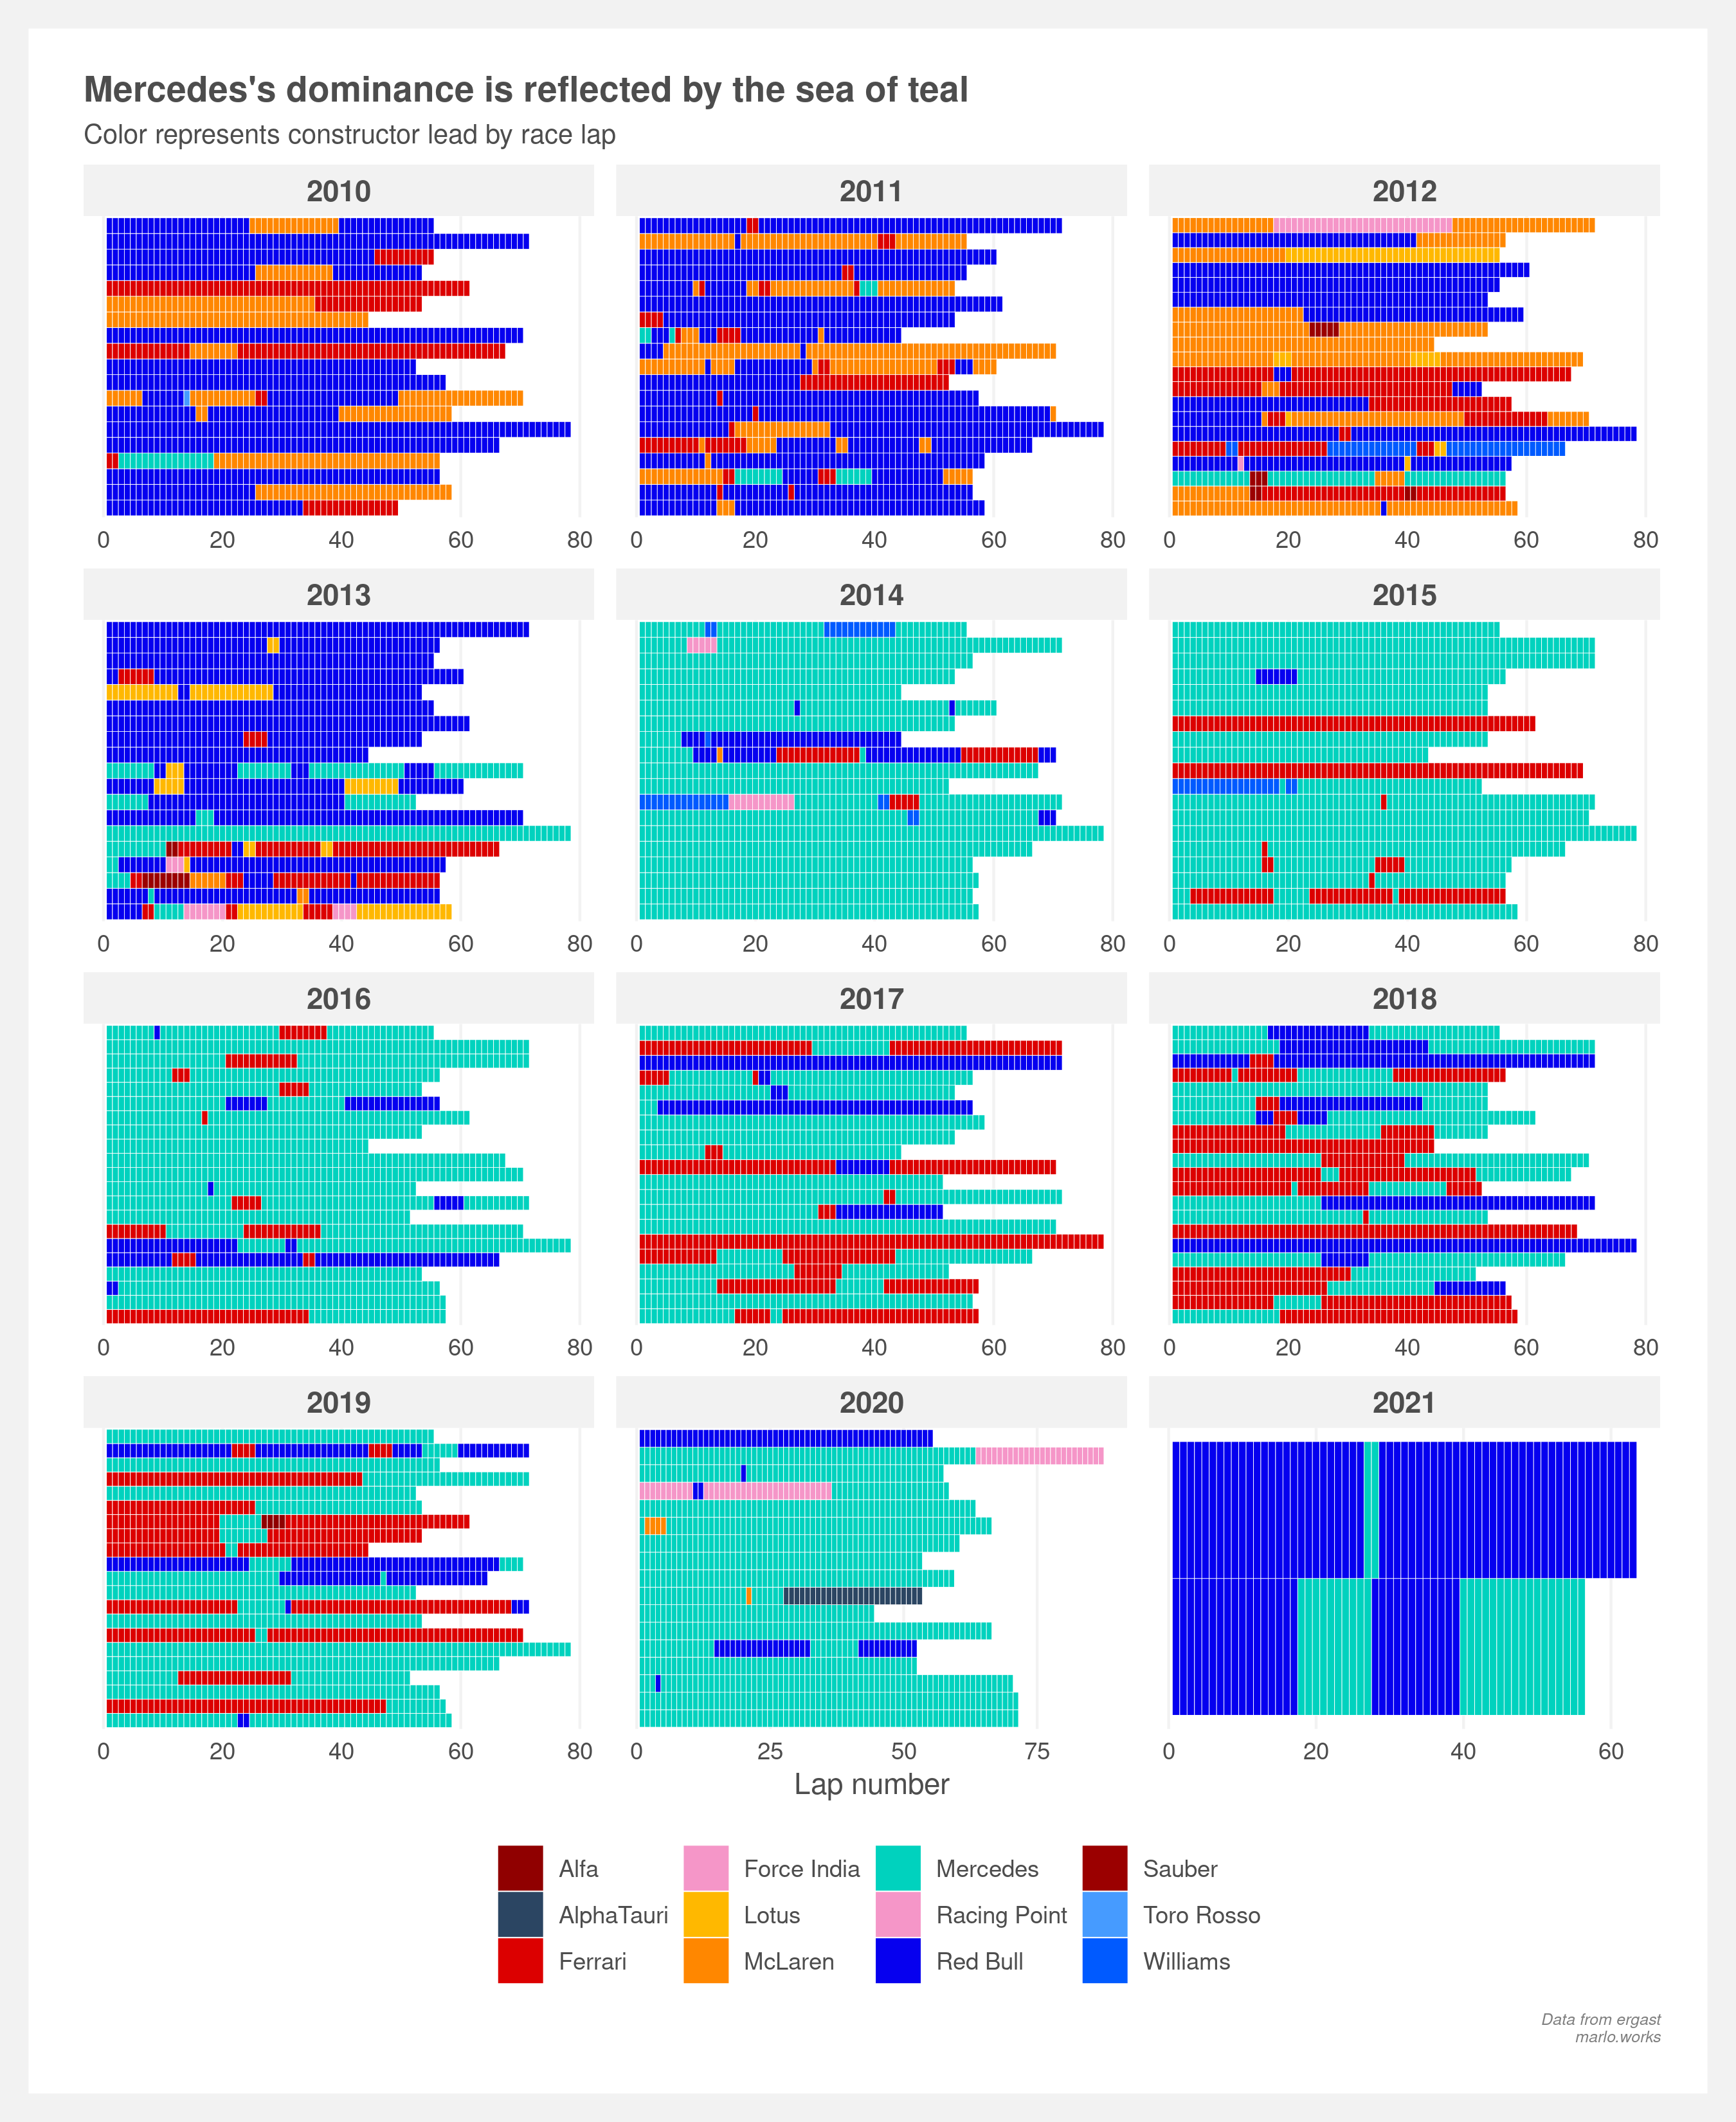
Changes in race lead are the most exciting moment of any race. Many of the objectively boring races consist of a single driver maintaining race lead on every lap – often Lewis Hamilton, represented within the many long strands of teal in the plot below.
Each horizontal sequence is a single race. The color represents the current constructor lap leader. Red Bull and Sebastian Vettel kick off the decade with a swath of blue. Once the hybrid engines are introduced in the 2014 season, Mercedes’s teal ascends to dominance. They are only briefly interrupted by sporadic Ferrari red 2017-2019.
Shannon entropy, often used to measure uncertainty in a probability distribution or understanding information gain, can be applied to these sequences of color to help us understand race monotony. Entropy, in this case, is a fancy method to quantify the number of race leaders within a race while accounting for the length of the lead stints and length of the entire race. It is a great proxy for excitement as greater entropy corresponds to more dynamic races.
For example, the sequence [HAM, BOT, VER, VER] will have a larger value than [HAM, HAM, VER, VER]. [HAM, VER, HAM] will be larger than [HAM, HAM, VER, HAM, HAM] despite both having only two changes. It also increases as leaders become more competitively balanced. [HAM, HAM, VER, VER] has a larger value than [HAM, VER, VER, VER] despite both only having one change. This reflects increasing excitement as the field of drivers becomes more balanced in the long-run. Entropy is an imperfect tool, though. The entropy of [HAM, VER, HAM, VER] is the same as [HAM, HAM, VER, VER] even though the former is clearly more exciting. An ideal metric would account for both positions and the number of changes.
A single summary number that captures all information in a sequence is a debated subject in sequence analysis. For the application here, weighing the standard Shannon entropy metric by the number of changes in race leader is appropriate. This new entropy metric increases with the number of race leader changes but still retains the core properties of entropy.
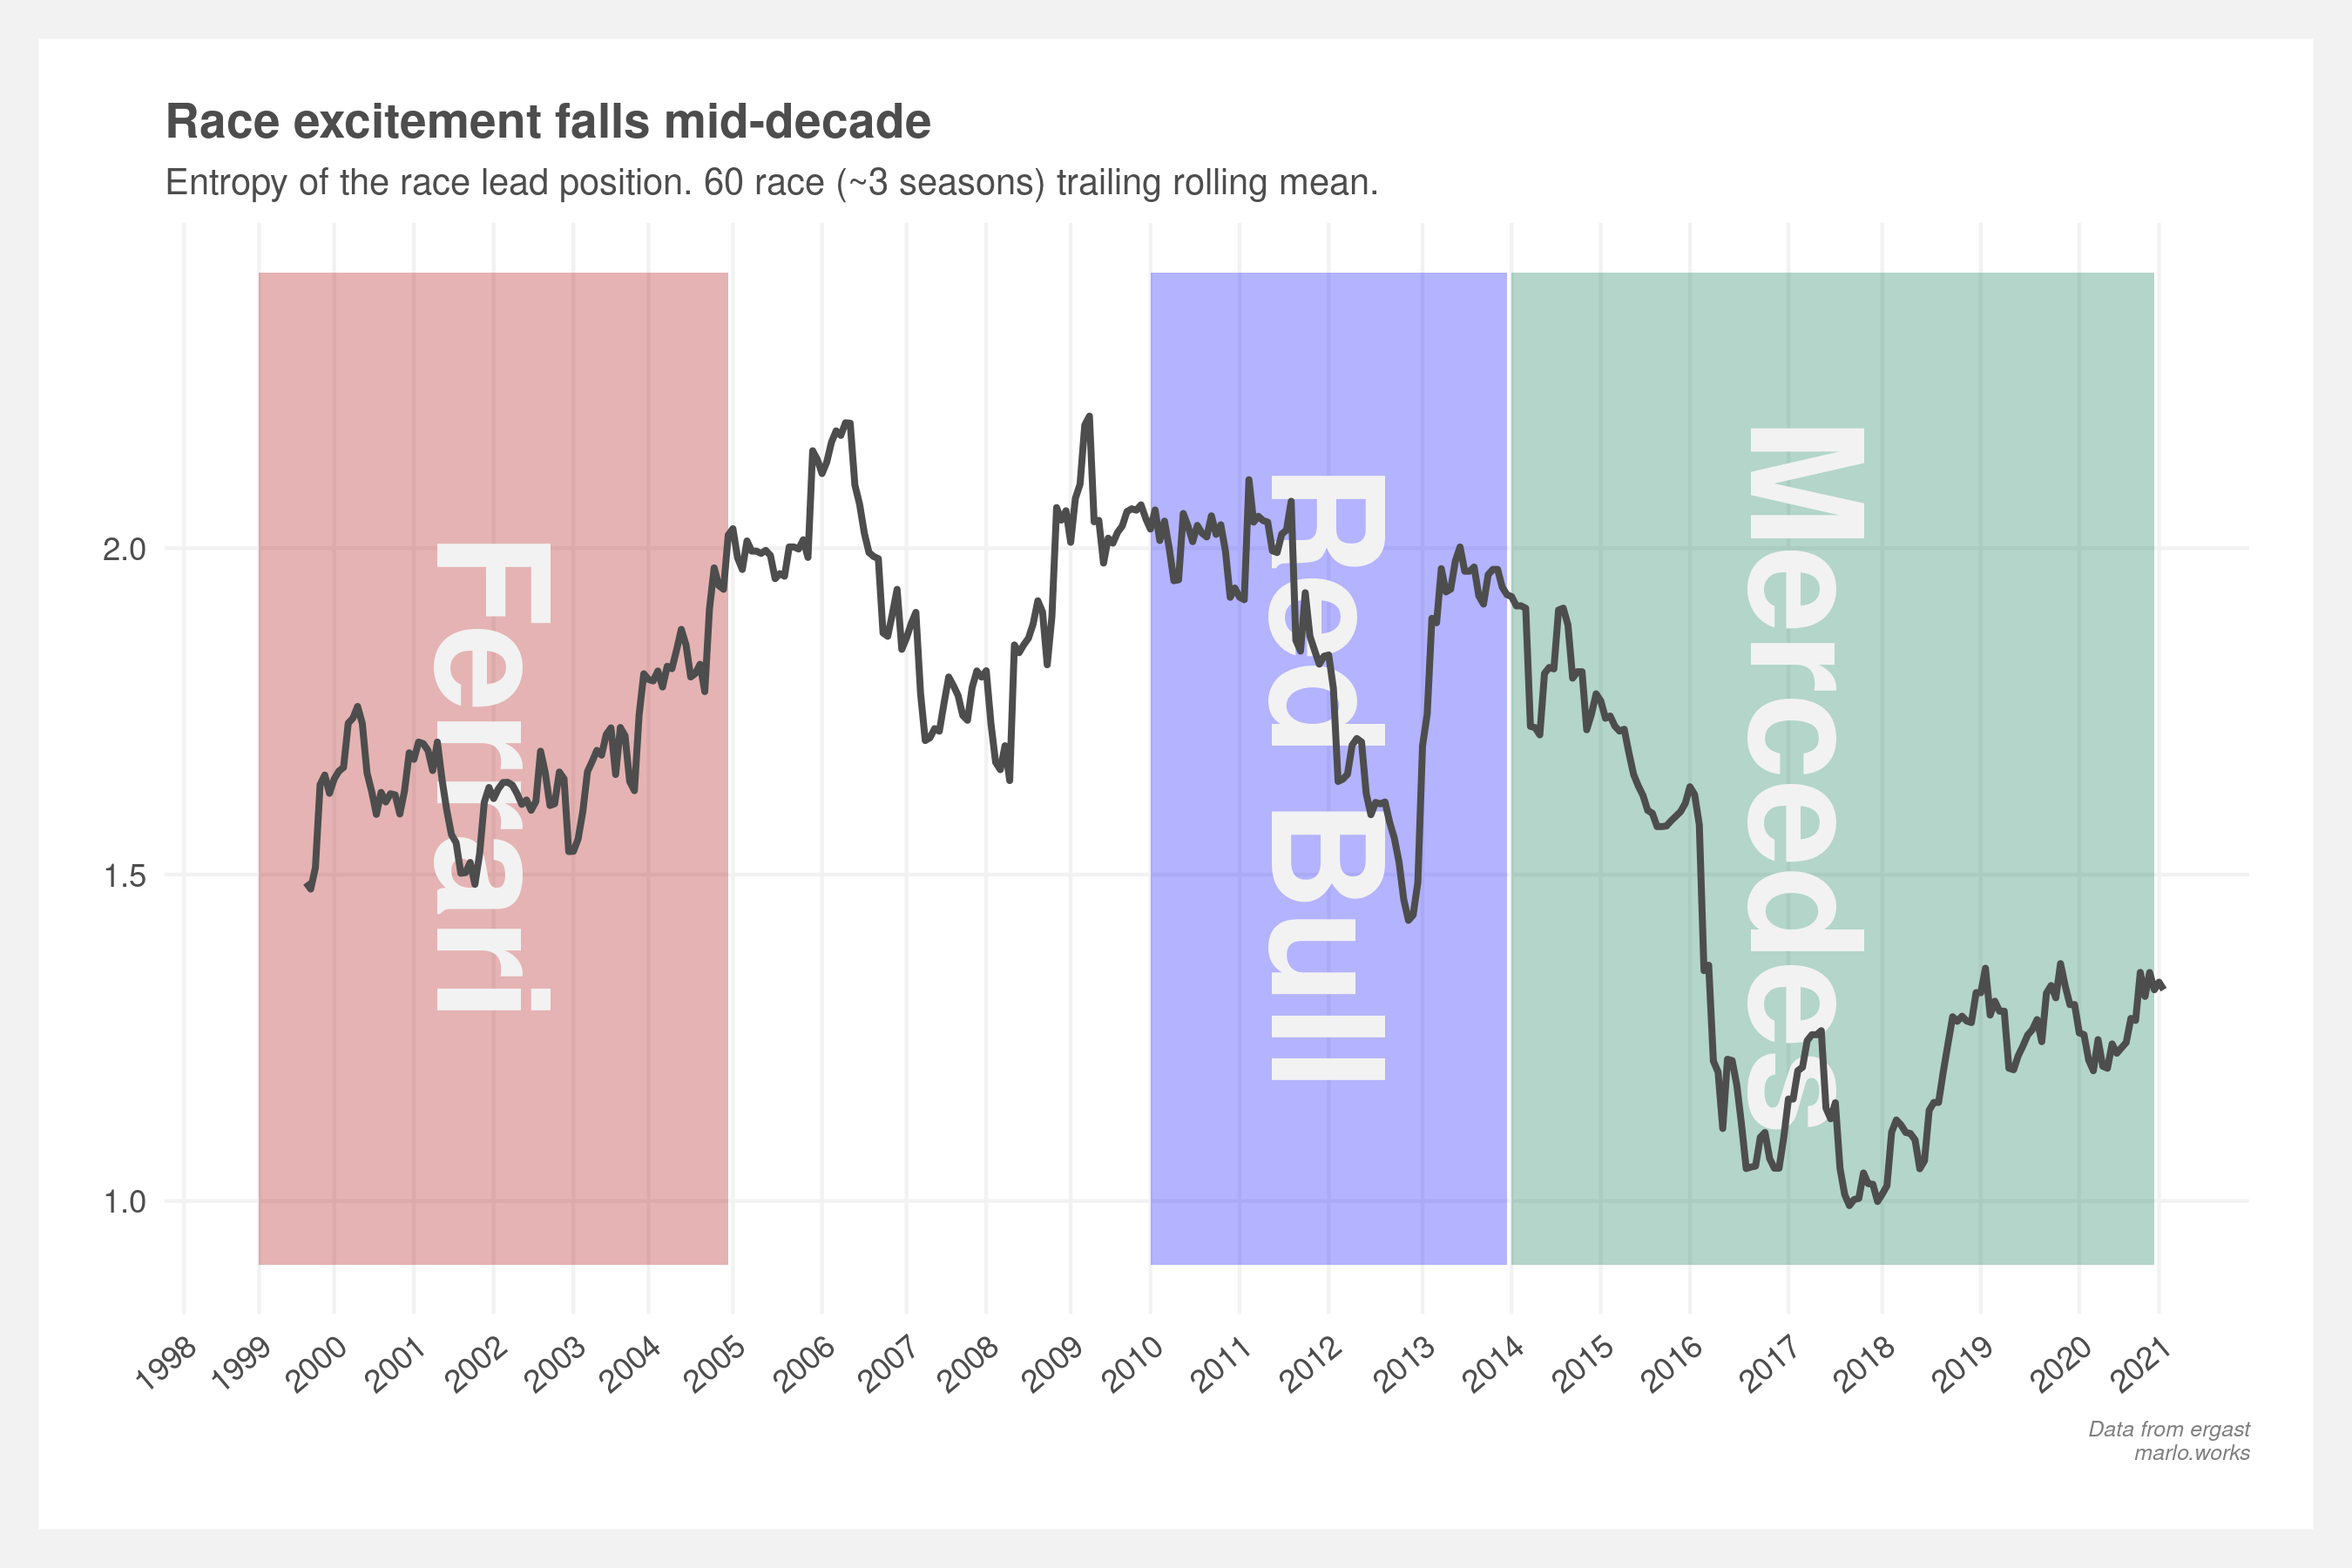
The moving average of entropy over the last two decades shows the slow and then sudden fall in excitement starting with Mercedes’s ascension. The decline starts sooner, though, during Red Bull’s reign. The below plot shows the trailing three season average – so perhaps we should equally blame Toto Wolff and Christian Horner. The trend inflects near 2019 and the recent rise corresponds with a return of excitement. Hopefully this recent trendline will continue upwards as excitement is still systemically low compared to the previous decade.
You claim you can measure excitement. Which race was the most exciting then?
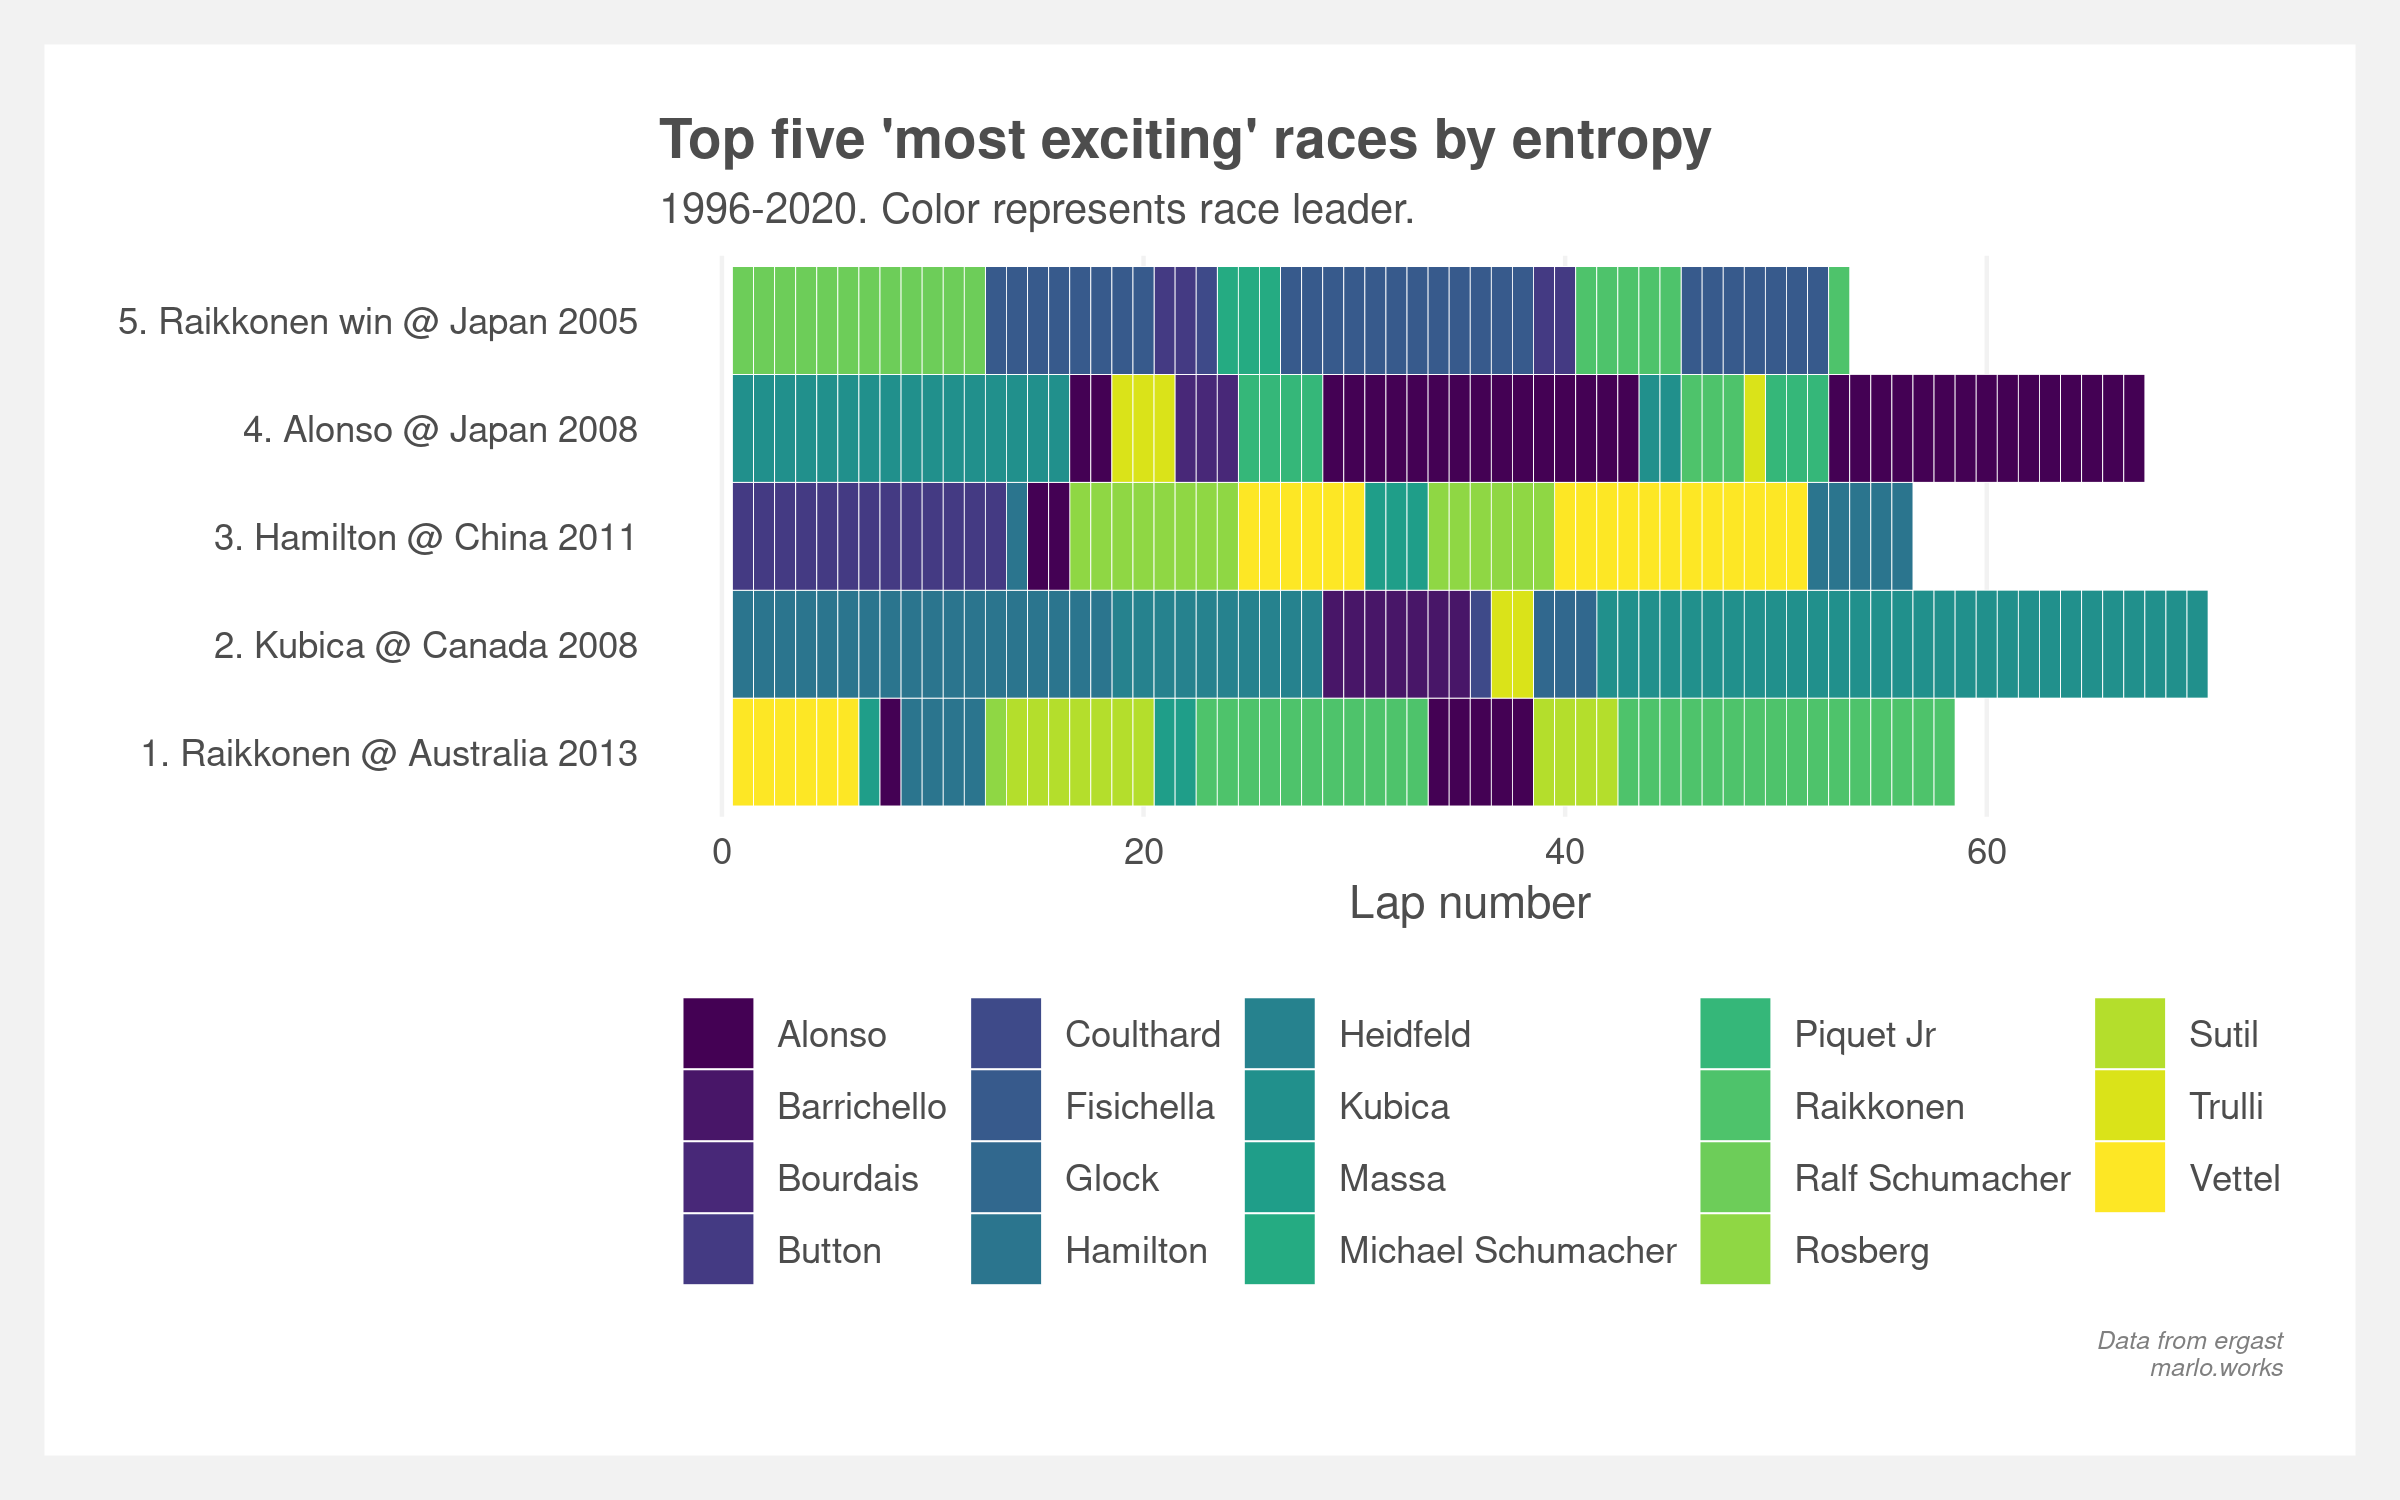
The top race by excitement was the season opener 2013 Australian Grand Prix with 10 changes in race leader. Openers often result in a chaotic shuffling of cars while drivers learn their new machine and the teams work out their latent rankings. The 2013 race also suffered from a wet qualifying session that mixed up the grid more than usual. The second most exciting race was Kubica’s revenge after his tremendous 2007 crash at the Canadian circuit. None of the top five had wet weather conditions during the race.
The inverse, the worst races by excitement, are races where the first lap leader maintained the lead throughout the entire race. There’s been 80 of these races since 1996.
But what about the midfield?
Formula One supporters (bolstered by television announcers and Formula One itself) enjoy pivoting the debate to the midfield. I agree changes in race lead do not tell the whole story. Mercedes dominated the 2020 season, but, as a viewer, it was an empirically exciting season. It was thanks to haphazard scheduling, novel circuits, double-headers, three red-flagged races, a driver reshuffling at the end of the season, and, of course, the terrible Grosjean incident.
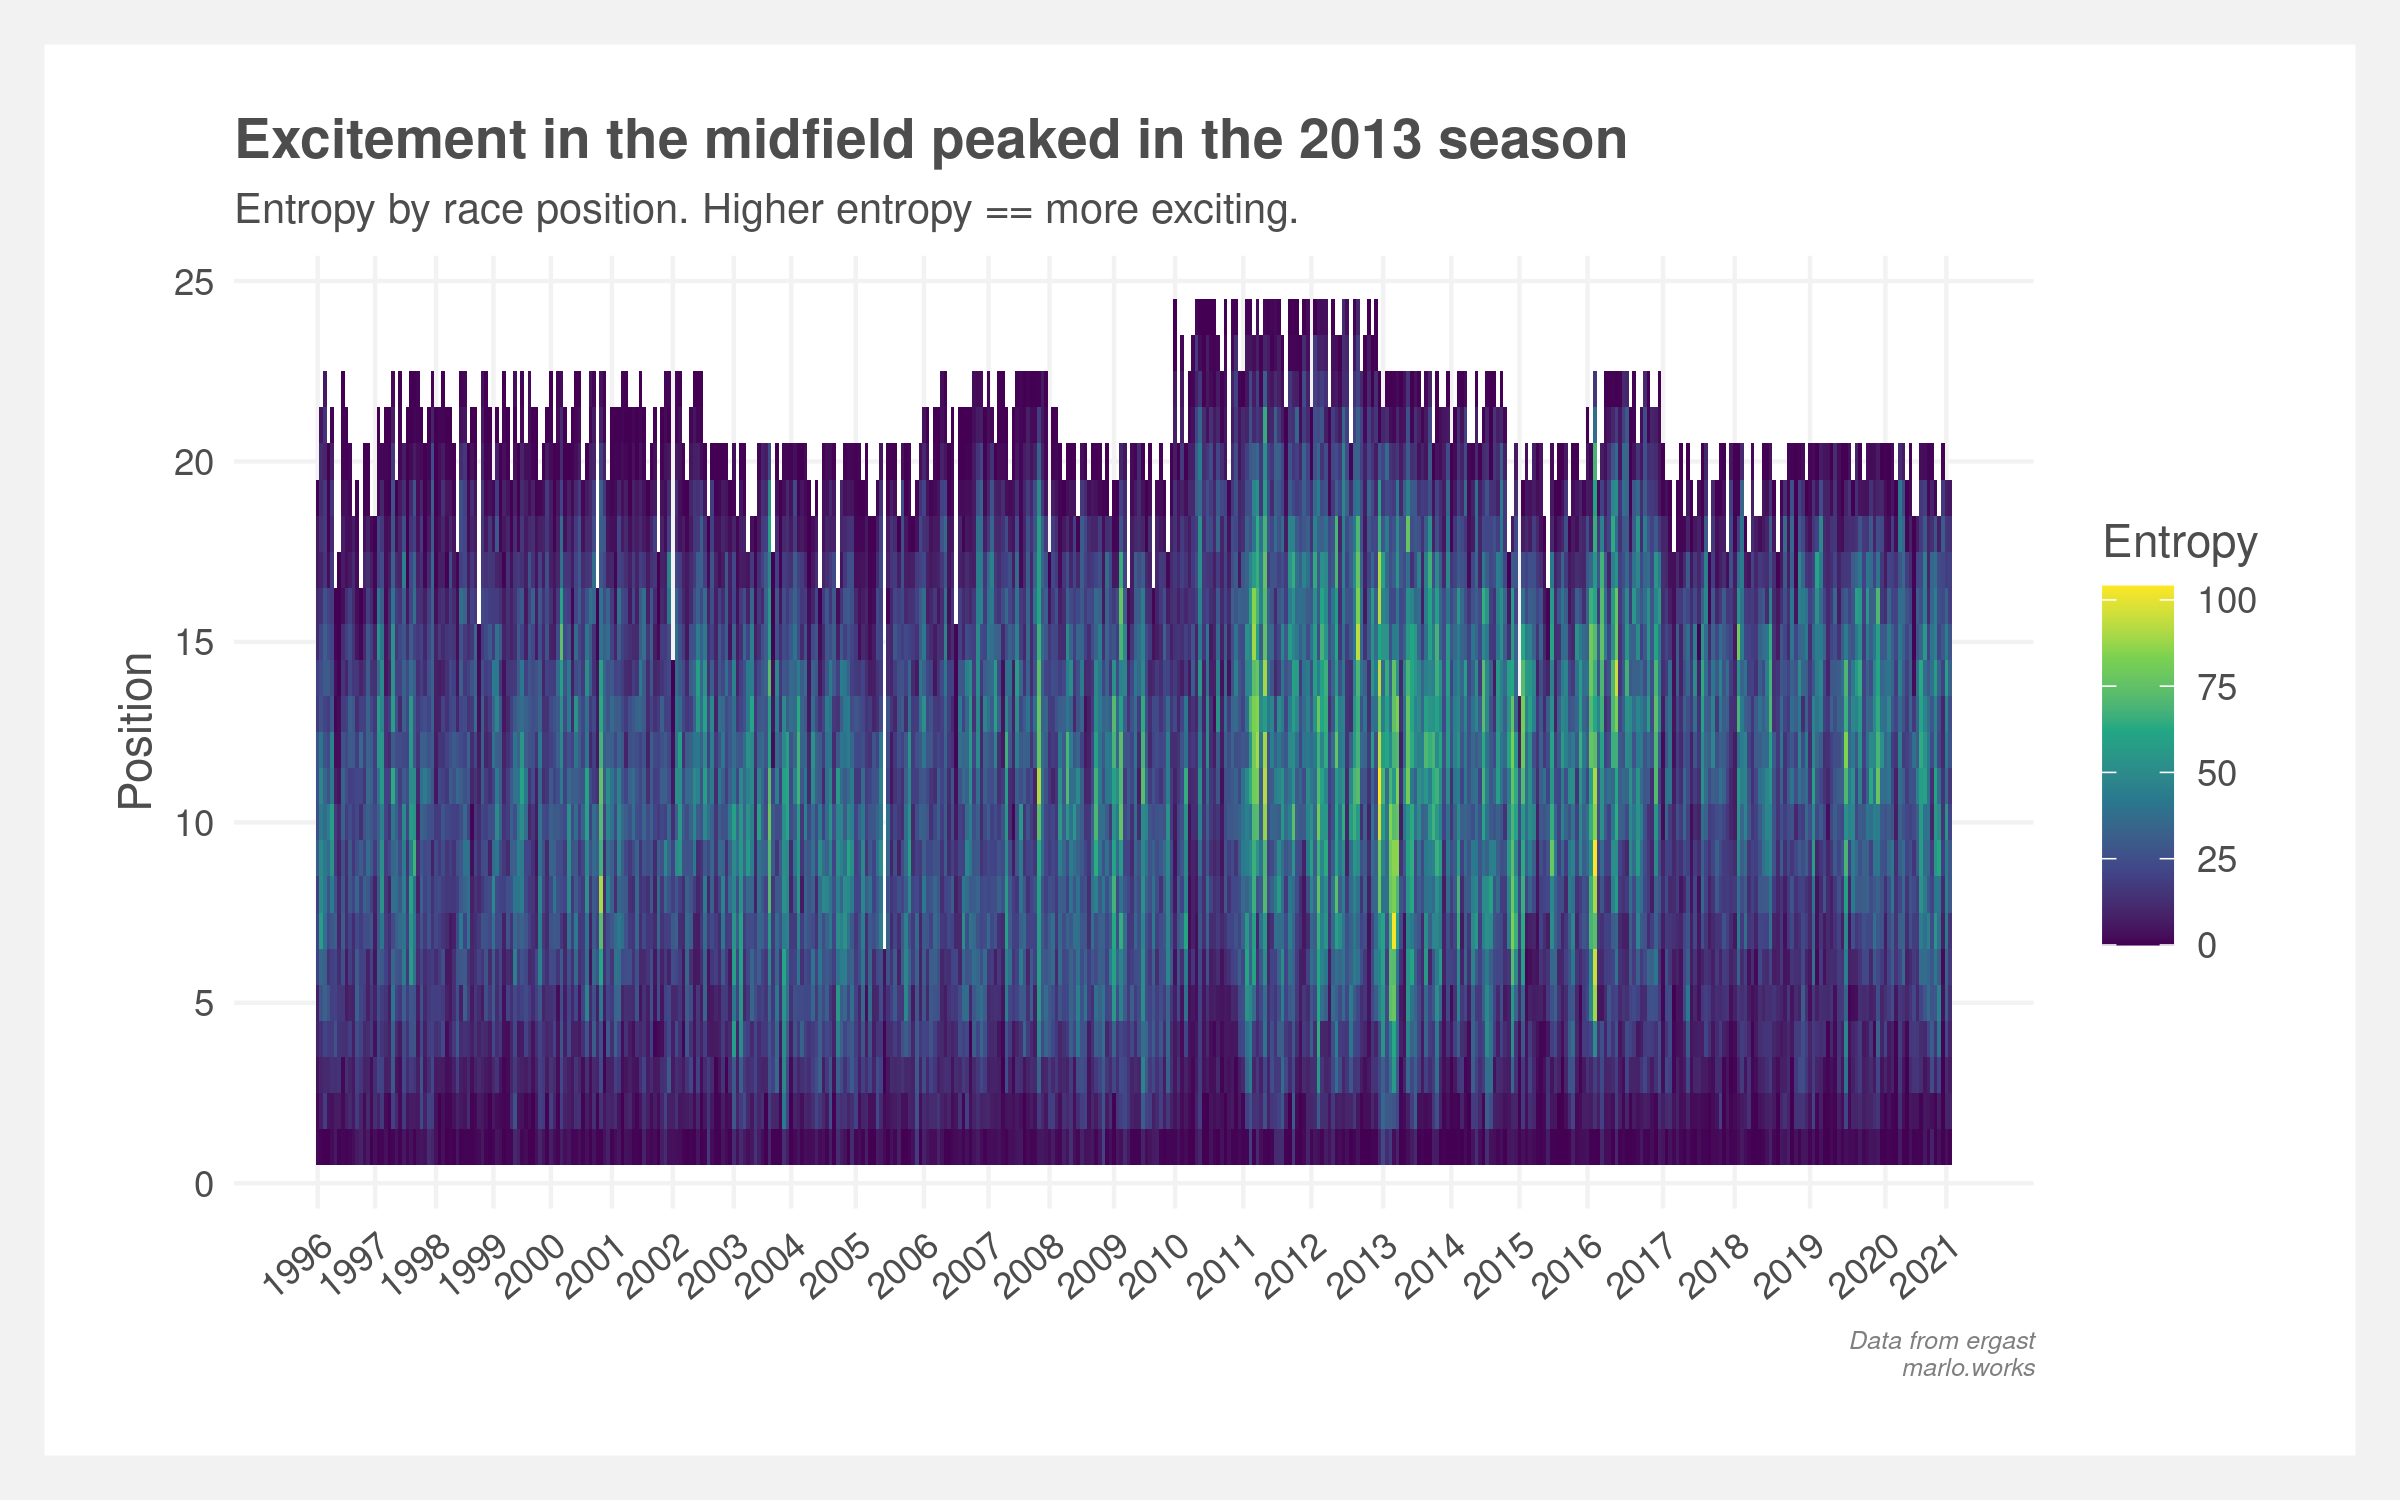
The midfield did appear strong in 2020, though, but the entropy measure does not firmly support it. Peak excitement was early in the decade where the below plot is brightest. The perceived 2020 midfield entertainment might be created from a shift in narratives – anecdotally the Sky Sports announcers covered the McLaren-Renault-Racing Point battles closer than past years.
Drawbacks
Entropy is a great measure of race excitement but, since this was all mostly for fun, there are a few drawbacks it does not directly address:
- Changes in lap leader due to pit strategy are not treated separately. A more nuanced approach would only consider swaps in on-track position.
- Changes in lap leader on the last lap are the most exciting. The current metric treats these equally with a change on the first lap. IRL one is not like the other.
- Entropy does not consider the time differential between drivers. A one second lead is treated the same as a 60 second lead.
- There is no assessment of cross-race entropy. The metric is applied within a race. A season of alternating full-race dominance by Red Bull and Mercedes would have the same measure as one team dominating.
- The 60 race / three season rolling average was chosen visually. The trend remains consistent across different values but 60 races qualitatively offers the best balance between signal and noise.
- The data consists of lap position at the end of each lap. Position swaps that occur within a lap and then swap back are not recorded. This underestimates entropy slightly but is likely unbiased across the years.
There are other metrics such as turbulence which measure, for lack of a specific word, some form of entropy of a sequence. These could be a better proxy for race excitement and a sensible next step for extending this work.
Note: all of the above only includes races from 1996 onwards. No data on individual laps was available prior.
2021 April
Find the code here: github.com/joemarlo/formula-one