Starburst Art
Using R to build beautiful digital artwork randomly
R is consistently lauded for its impressive data plotting capabilities. These capabilities can be co-opted to create beautiful art, programmatically. Below are a few examples of my results using a single core function that accepts many parameters and outputs a semi-randomly generated plot.
The general idea is to create:
- One generic function that can plot segments with given inputs such as segment end positions and color values. Add a bit of randomness for effect. Shapes can be created by passing values to the segment positions. For example,
sin(),cos(), andpivalues can be used to create circle and semi circles- this is
buildFan()
- this is
- A second function that wraps around the first to print multiple plots. It also allows parameters across the plots such as color gradients and shapes
- this is
printFans()
- this is
If you’re more interested in this, I encourage you to tweak (and improve) my code along with checking out Data-to-Art.
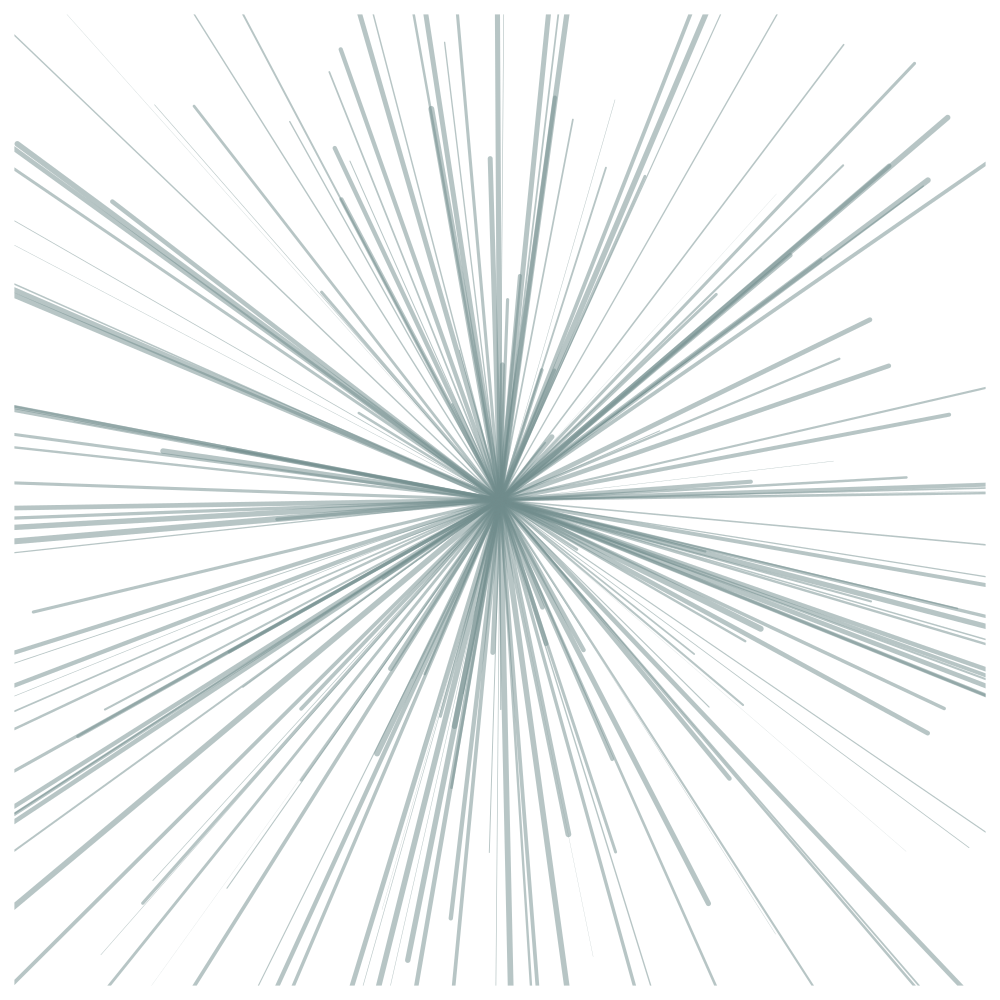
# build a single fan
buildFan()
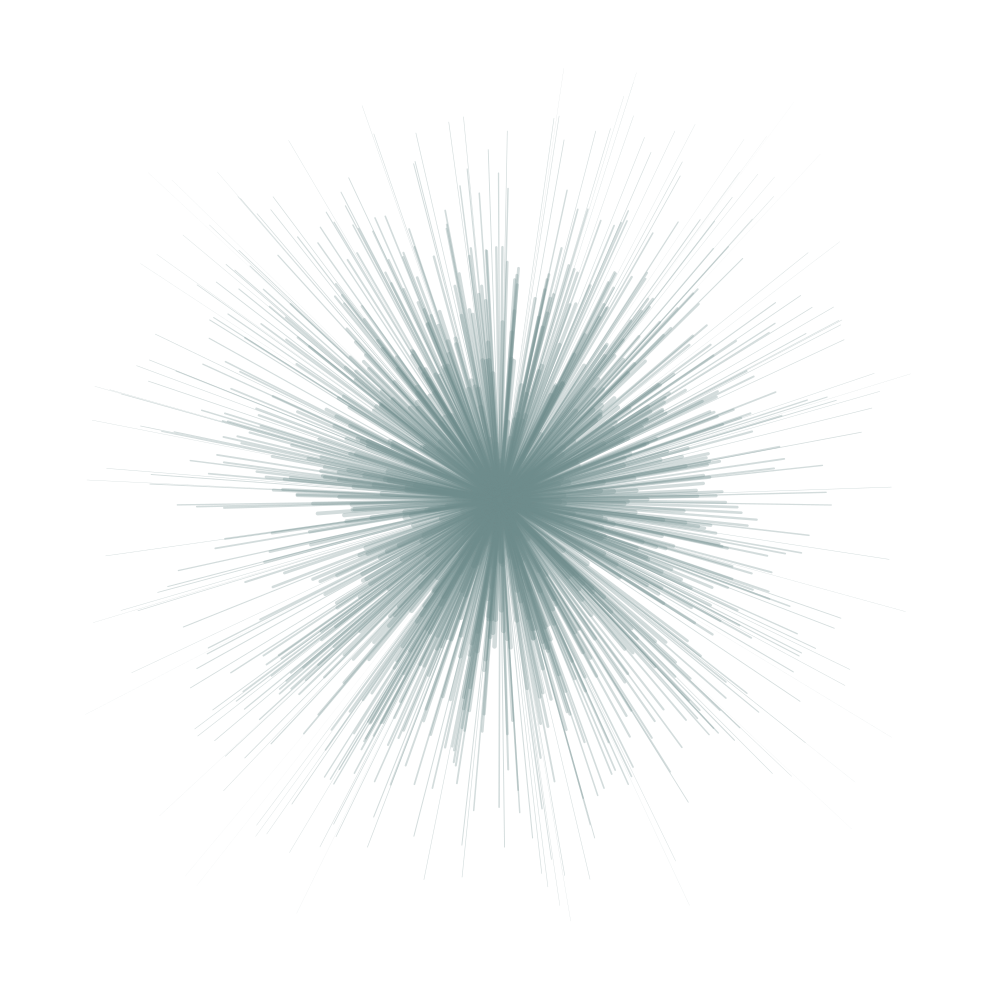
# tweak the fan's properties
buildFan(n.segments = 1000,
         x.end = runif(1000, -1, 1),
         y.end = runif(1000, -1, 1),
         x.center = rep(0, 1000),
         y.center = rep(0, 1000),
         alpha = 0.3,
         depth = TRUE)
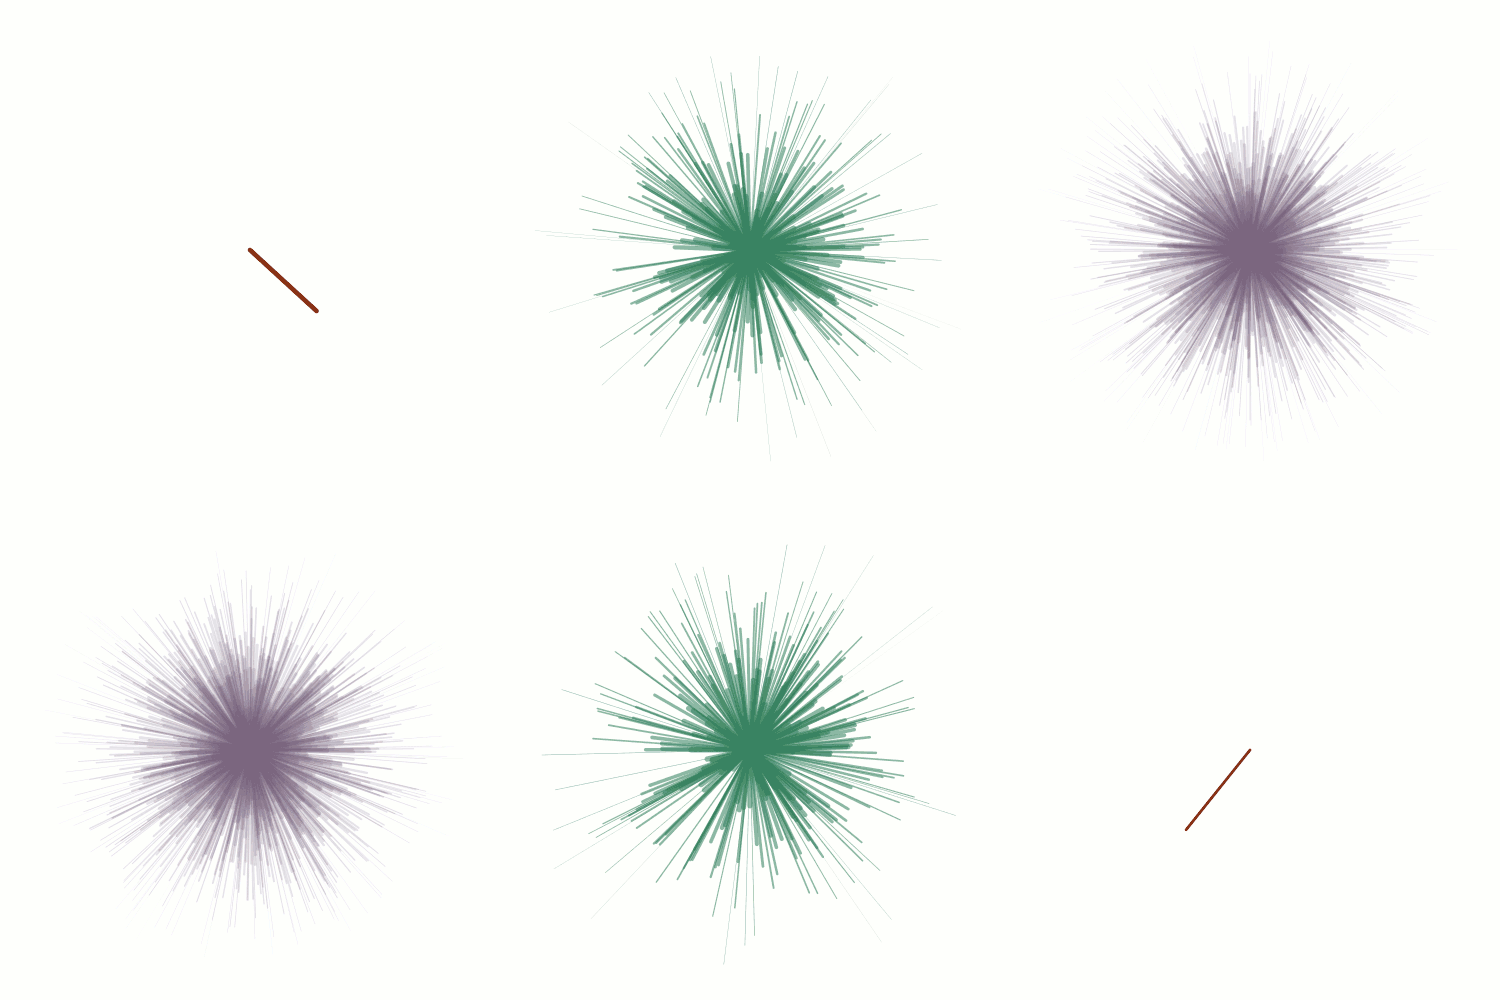
You can create animated gifs by saving many plots and then collapse them into a GIF use imagemagick shell commands:
# gif rendering requires imagemagick to be installed
#  see https://imagemagick.org/ or brew install imagemagick
setwd("Plotted_images/Gifs")

# gif of single fan
png(filename = paste0('fan%02d.png'),
    width = 500,
    height = 500)
for (i in c(1:40, 39:1)){

  # set the number of segments to plot
  n <- floor(i^2)

  buildFan(hue = i/40,
           saturation = 1- i/40,
           value = 0.5,
           alpha = 1 - (i/40),
           n.segments = n,
           x.end = runif(n, -1, 1),
           y.end = runif(n, -1, 1),
           x.center = rep(0, n),
           y.center = rep(0, n),
           depth = TRUE)
}
dev.off()
system("convert -delay 20 *.png single_fan.gif")
file.remove(list.files(pattern = ".png"))
# gif parameters
n.frames <- 100
logis.curve <- 1 / ( 1 + exp(seq(4, -5, length = n.frames/2)))
logis.curve <- c(logis.curve, rev(logis.curve))
rescaleVector <- function(x, min = .1, max = .9) (x - min(x))/(max(x) - min(x)) * (max - min) + min

# set where to save
png(filename = paste0('fan%02d.png'),
    width = 1250,
    height = 1250)
for (i in 1:n.frames){

  # set the number of segments to plot
  n <- floor(logis.curve[i]*250)

  buildFan(hue = rescaleVector(logis.curve)[i],
           saturation = .6,
           value = 0.5,
           hue.range = 0.20,
           saturation.range = 0.20,
           value.range = 0.20,
           alpha =  1 - rescaleVector(logis.curve)[i],
           alpha.range = 0.10,
           segment.width = 6,
           n.segments = n,
           x.end = runif(n, -1, 1),
           y.end = runif(n, -1, 1),
           x.center = rep(0, n),
           y.center = rep(0, n),
           depth = TRUE
  )
}
dev.off()
system("convert -delay 20 *.png depth_fan.gif")
file.remove(list.files(pattern = ".png"))
# set where to save
png(filename = paste0('fan%02d.png'),
    width = 1250,
    height = 800)

for (i in 1:n.frames){

  # set the number of segments to plot
  n <- floor(logis.curve[i]*400)

  # semi circle
  base.vector <- seq(0, pi, length = n)
  x.vector <- cos(base.vector)
  y.vector <- sin(base.vector) * 2 - 1

  buildFan(hue = rescaleVector(logis.curve, min = 0.3, max = .6)[i],
           saturation = .45,
           value = 0.4,
           hue.range = 0.20,
           saturation.range = 0.20,
           value.range = 0.20,
           alpha =  1 - rescaleVector(logis.curve, min = .6, max = .95)[i],
           alpha.range = 0.30,
           segment.width = 20,
           n.segments = n,
           x.end = x.vector,
           y.end = y.vector,
           x.center = 0,
           y.center = -1
  )
}
dev.off()
system("convert -delay 20 *.png semi_fan.gif")
file.remove(list.files(pattern = ".png"))
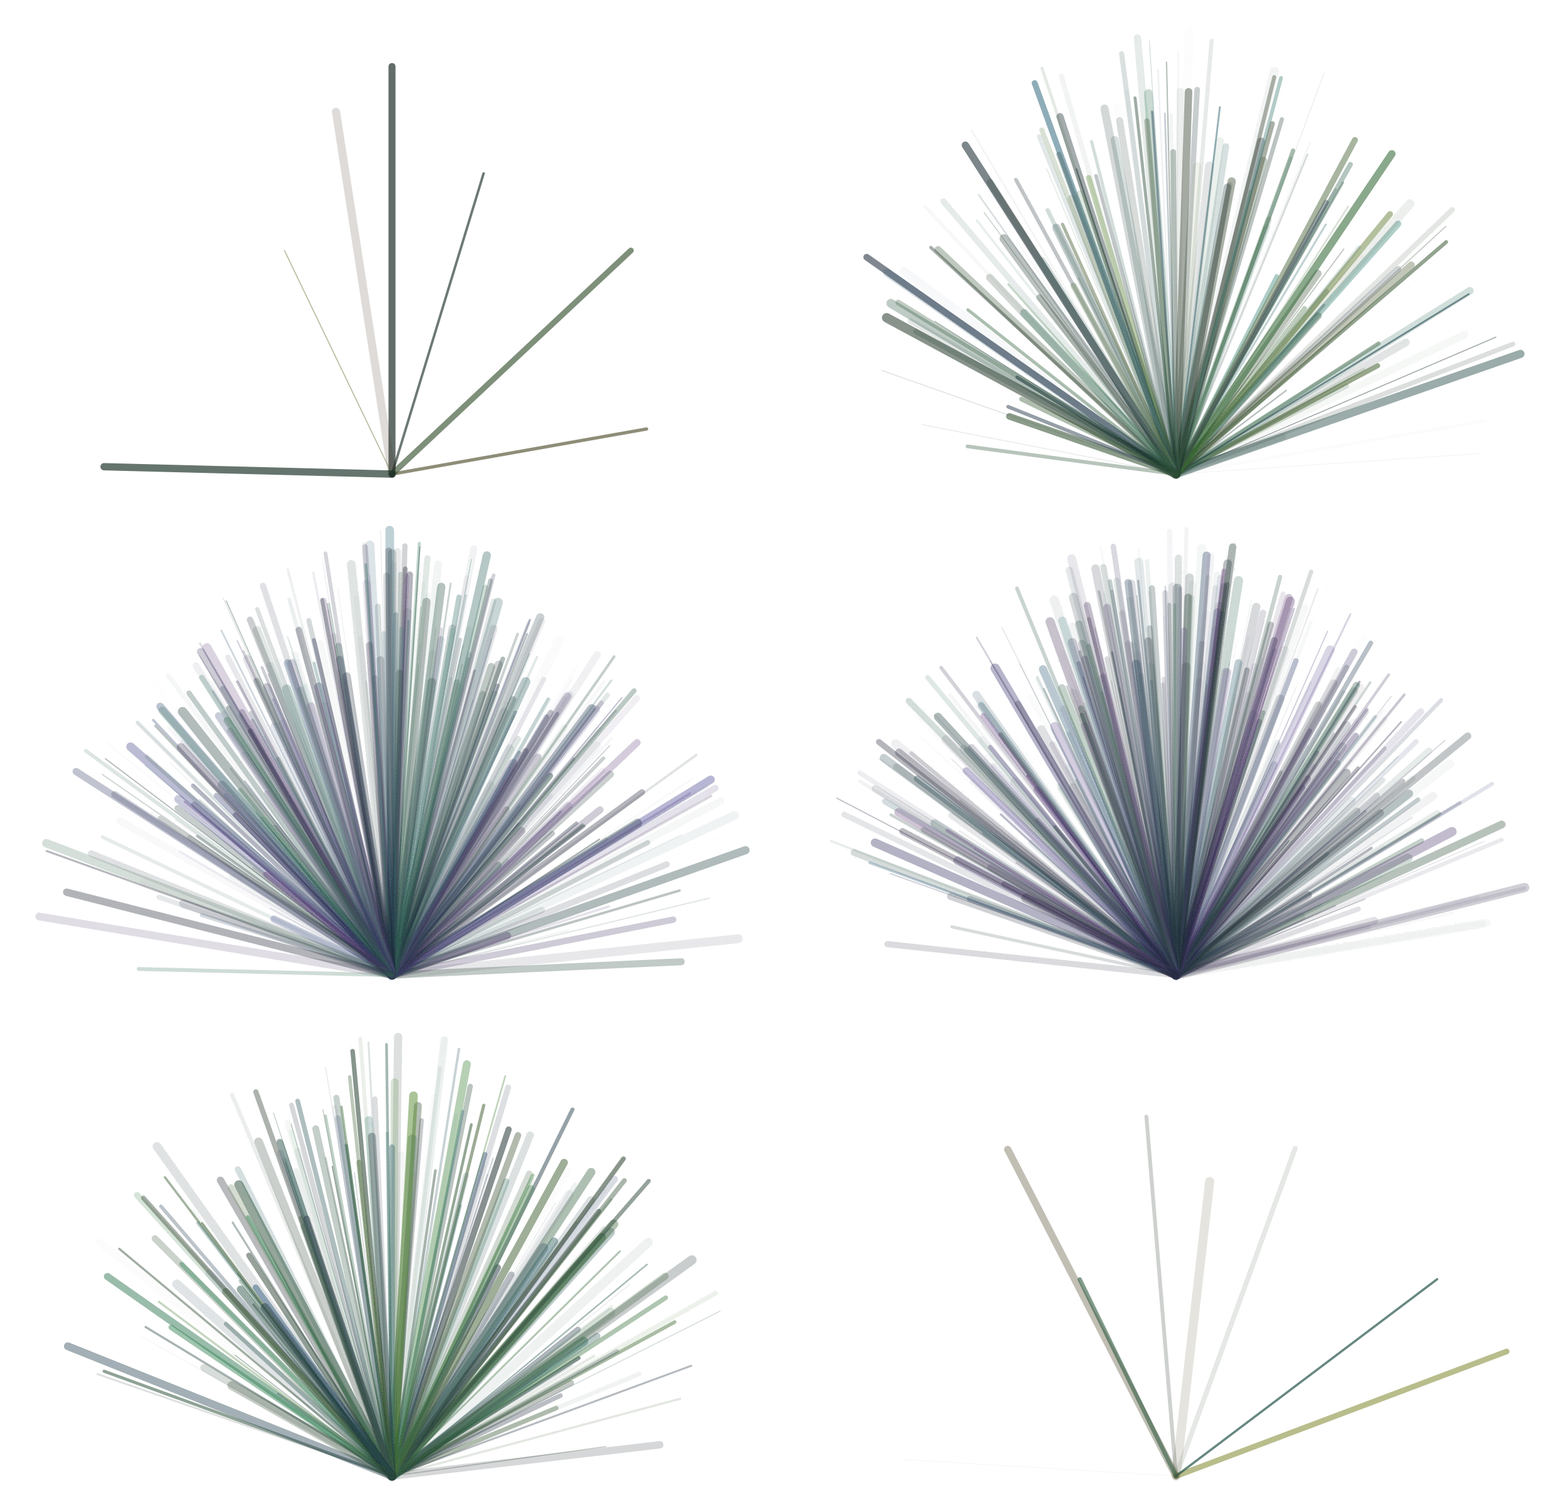
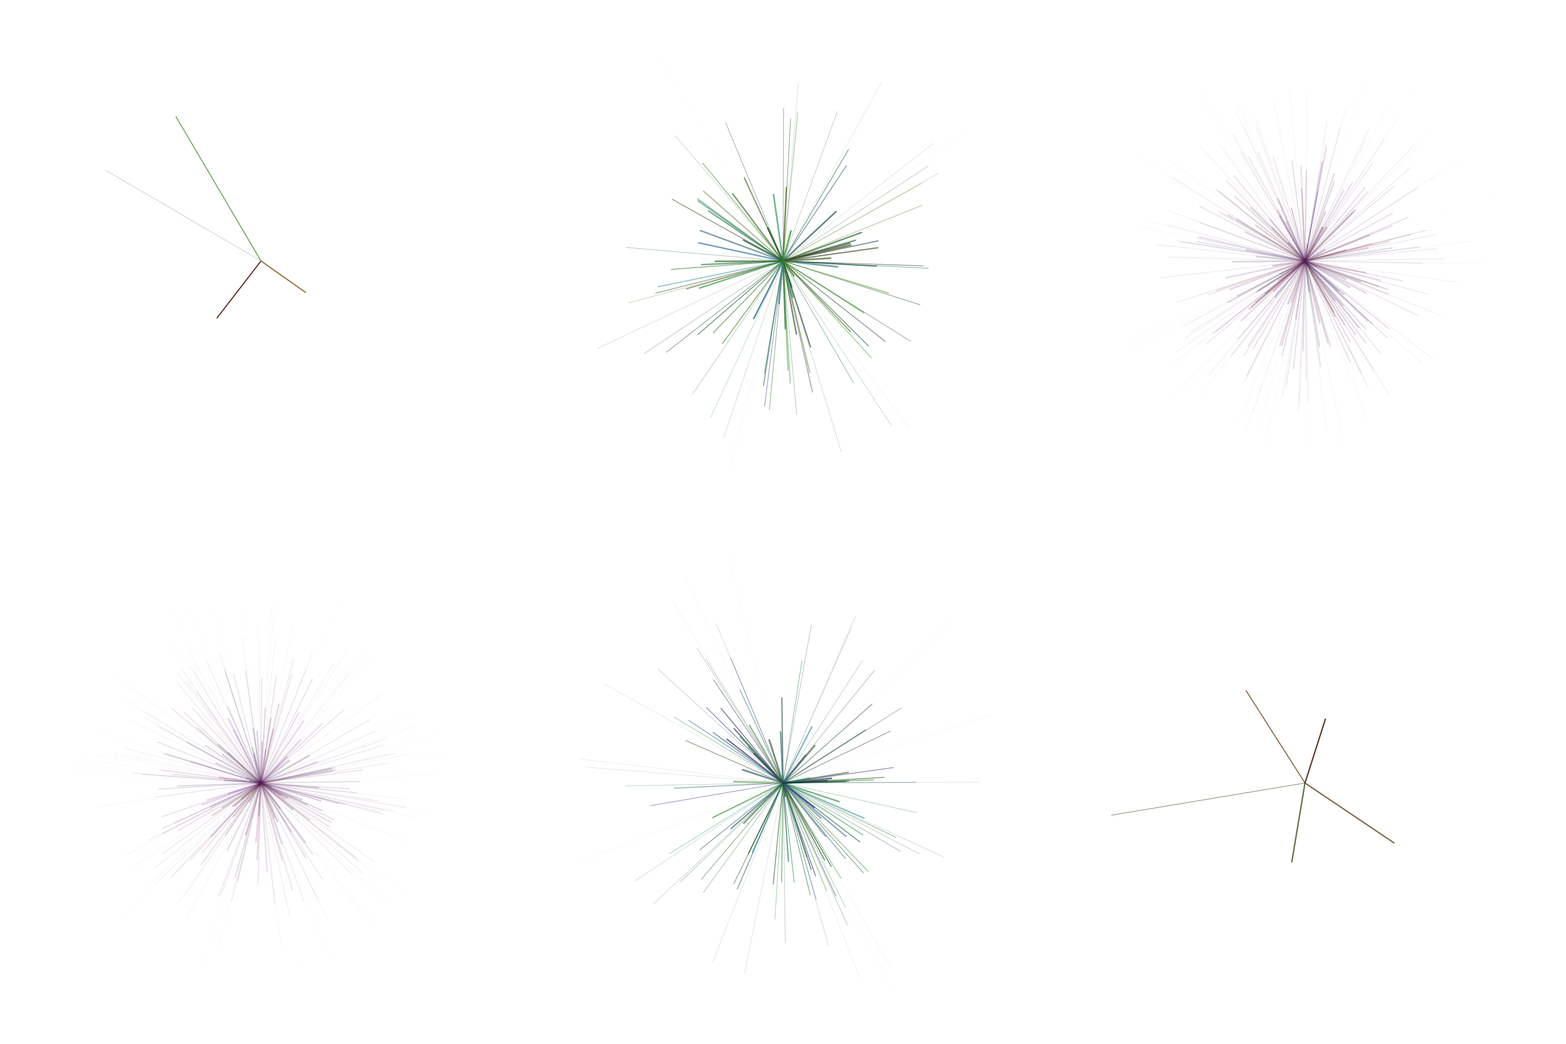
You can create animated gifs across plots, specifying individual parameters to create effects.
# gif of many fans with sequencing pattern
# gif parameters
n.frames <- 12*8
hues <- rep(seq(0, 1, length = 12), 12)
logis.curve <- 1 / ( 1 + exp(seq(4, -4, length = n.frames/2)))
logis.curve <- c(logis.curve, rev(logis.curve))
loop.vec <- c(10:11, 0:11, 0)

# set where to save
png(filename = 'fan%02d.png',
    width = 1250,
    height = 1250)

for (i in 1:n.frames){

  # set graphical parameters
  par(bg = 'white',
      mar = rep(2, 4),
      mfrow = c(3, 4),
      bty = "n")

  # set the number of segments to plot
  n <-  floor(logis.curve[i] * 250)

  for (j in 1:12) {

    # logic controls the plot sequence
    if (i %% 12 %in% loop.vec[(j+3)-0:3]){
      buildFan(
        hue = hues[j + i],
        saturation = .7,
        value = 0.5,
        alpha = 1 - logis.curve[i],
        n.segments = n,
        x.end = runif(n, -1, 1),
        y.end = runif(n, -1, 1),
        # x.center = rep(0, n),
        # y.center = rep(0, n),
        depth = TRUE,
        random.center = TRUE
      )
    } else {
      # build a blank plot
      buildFan(alpha = 0)
    }
  }
}
dev.off()
system("convert -delay 40 *.png multi_fan.gif")
file.remove(list.files(pattern = ".png"))
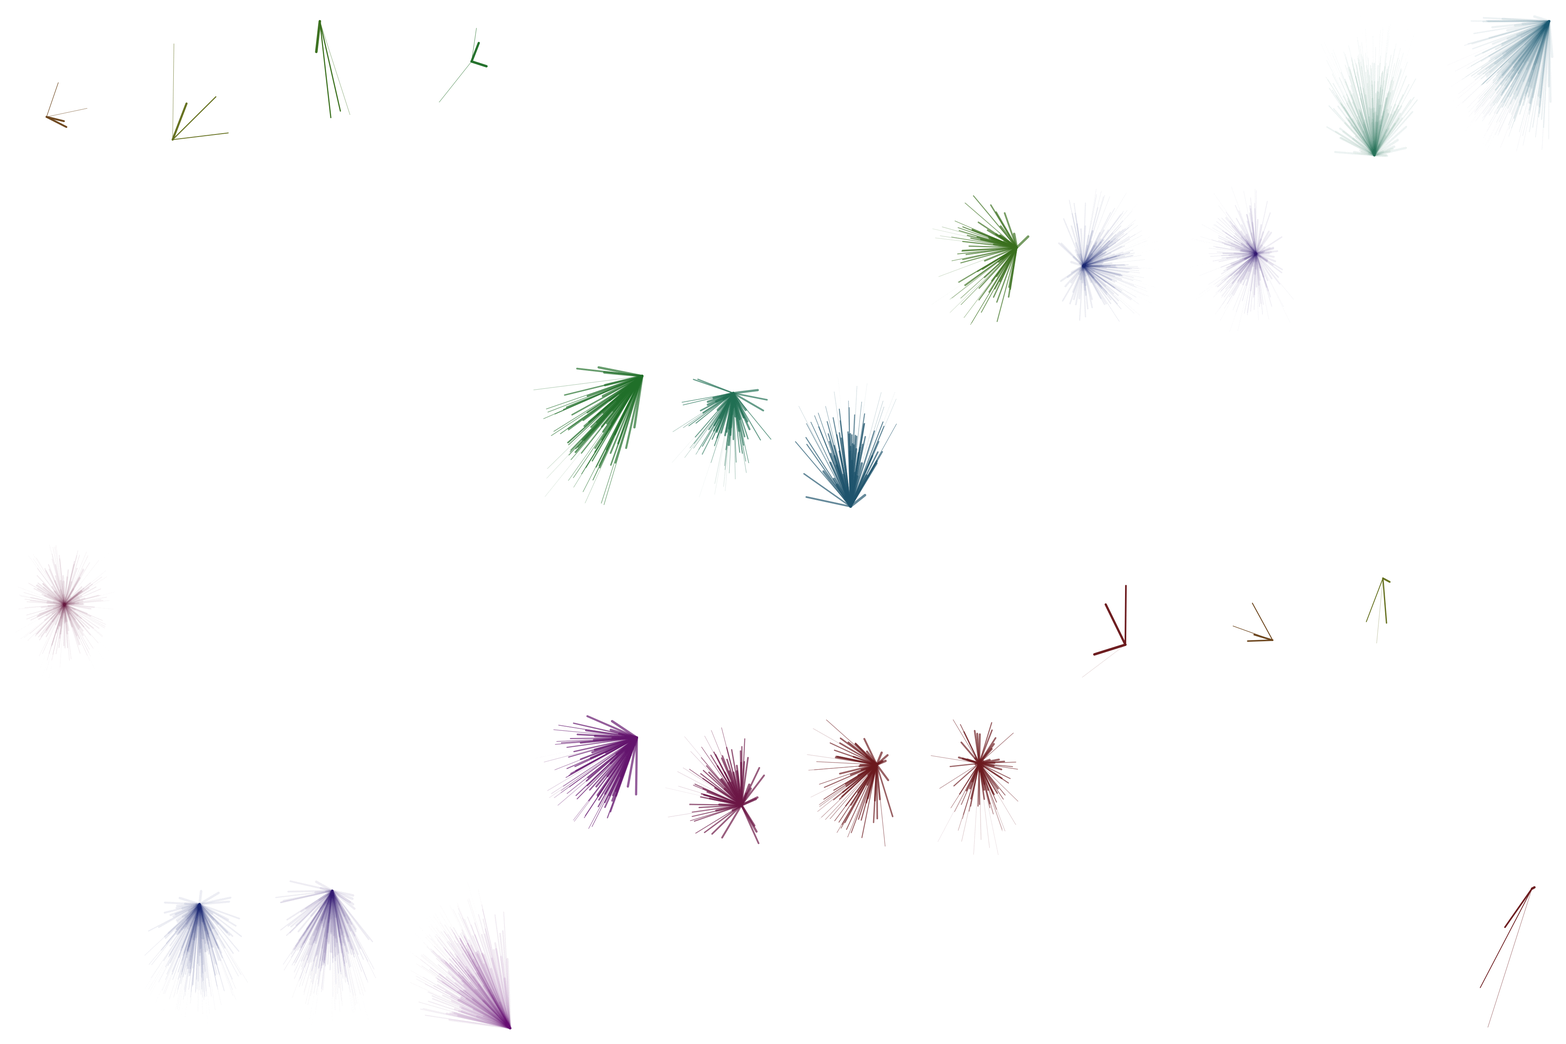
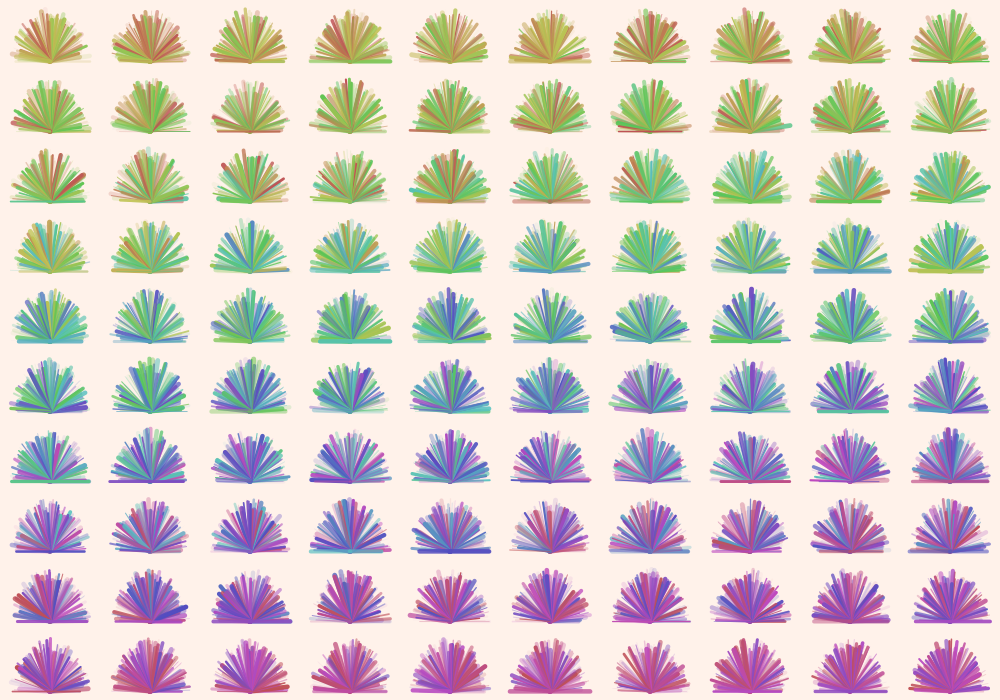
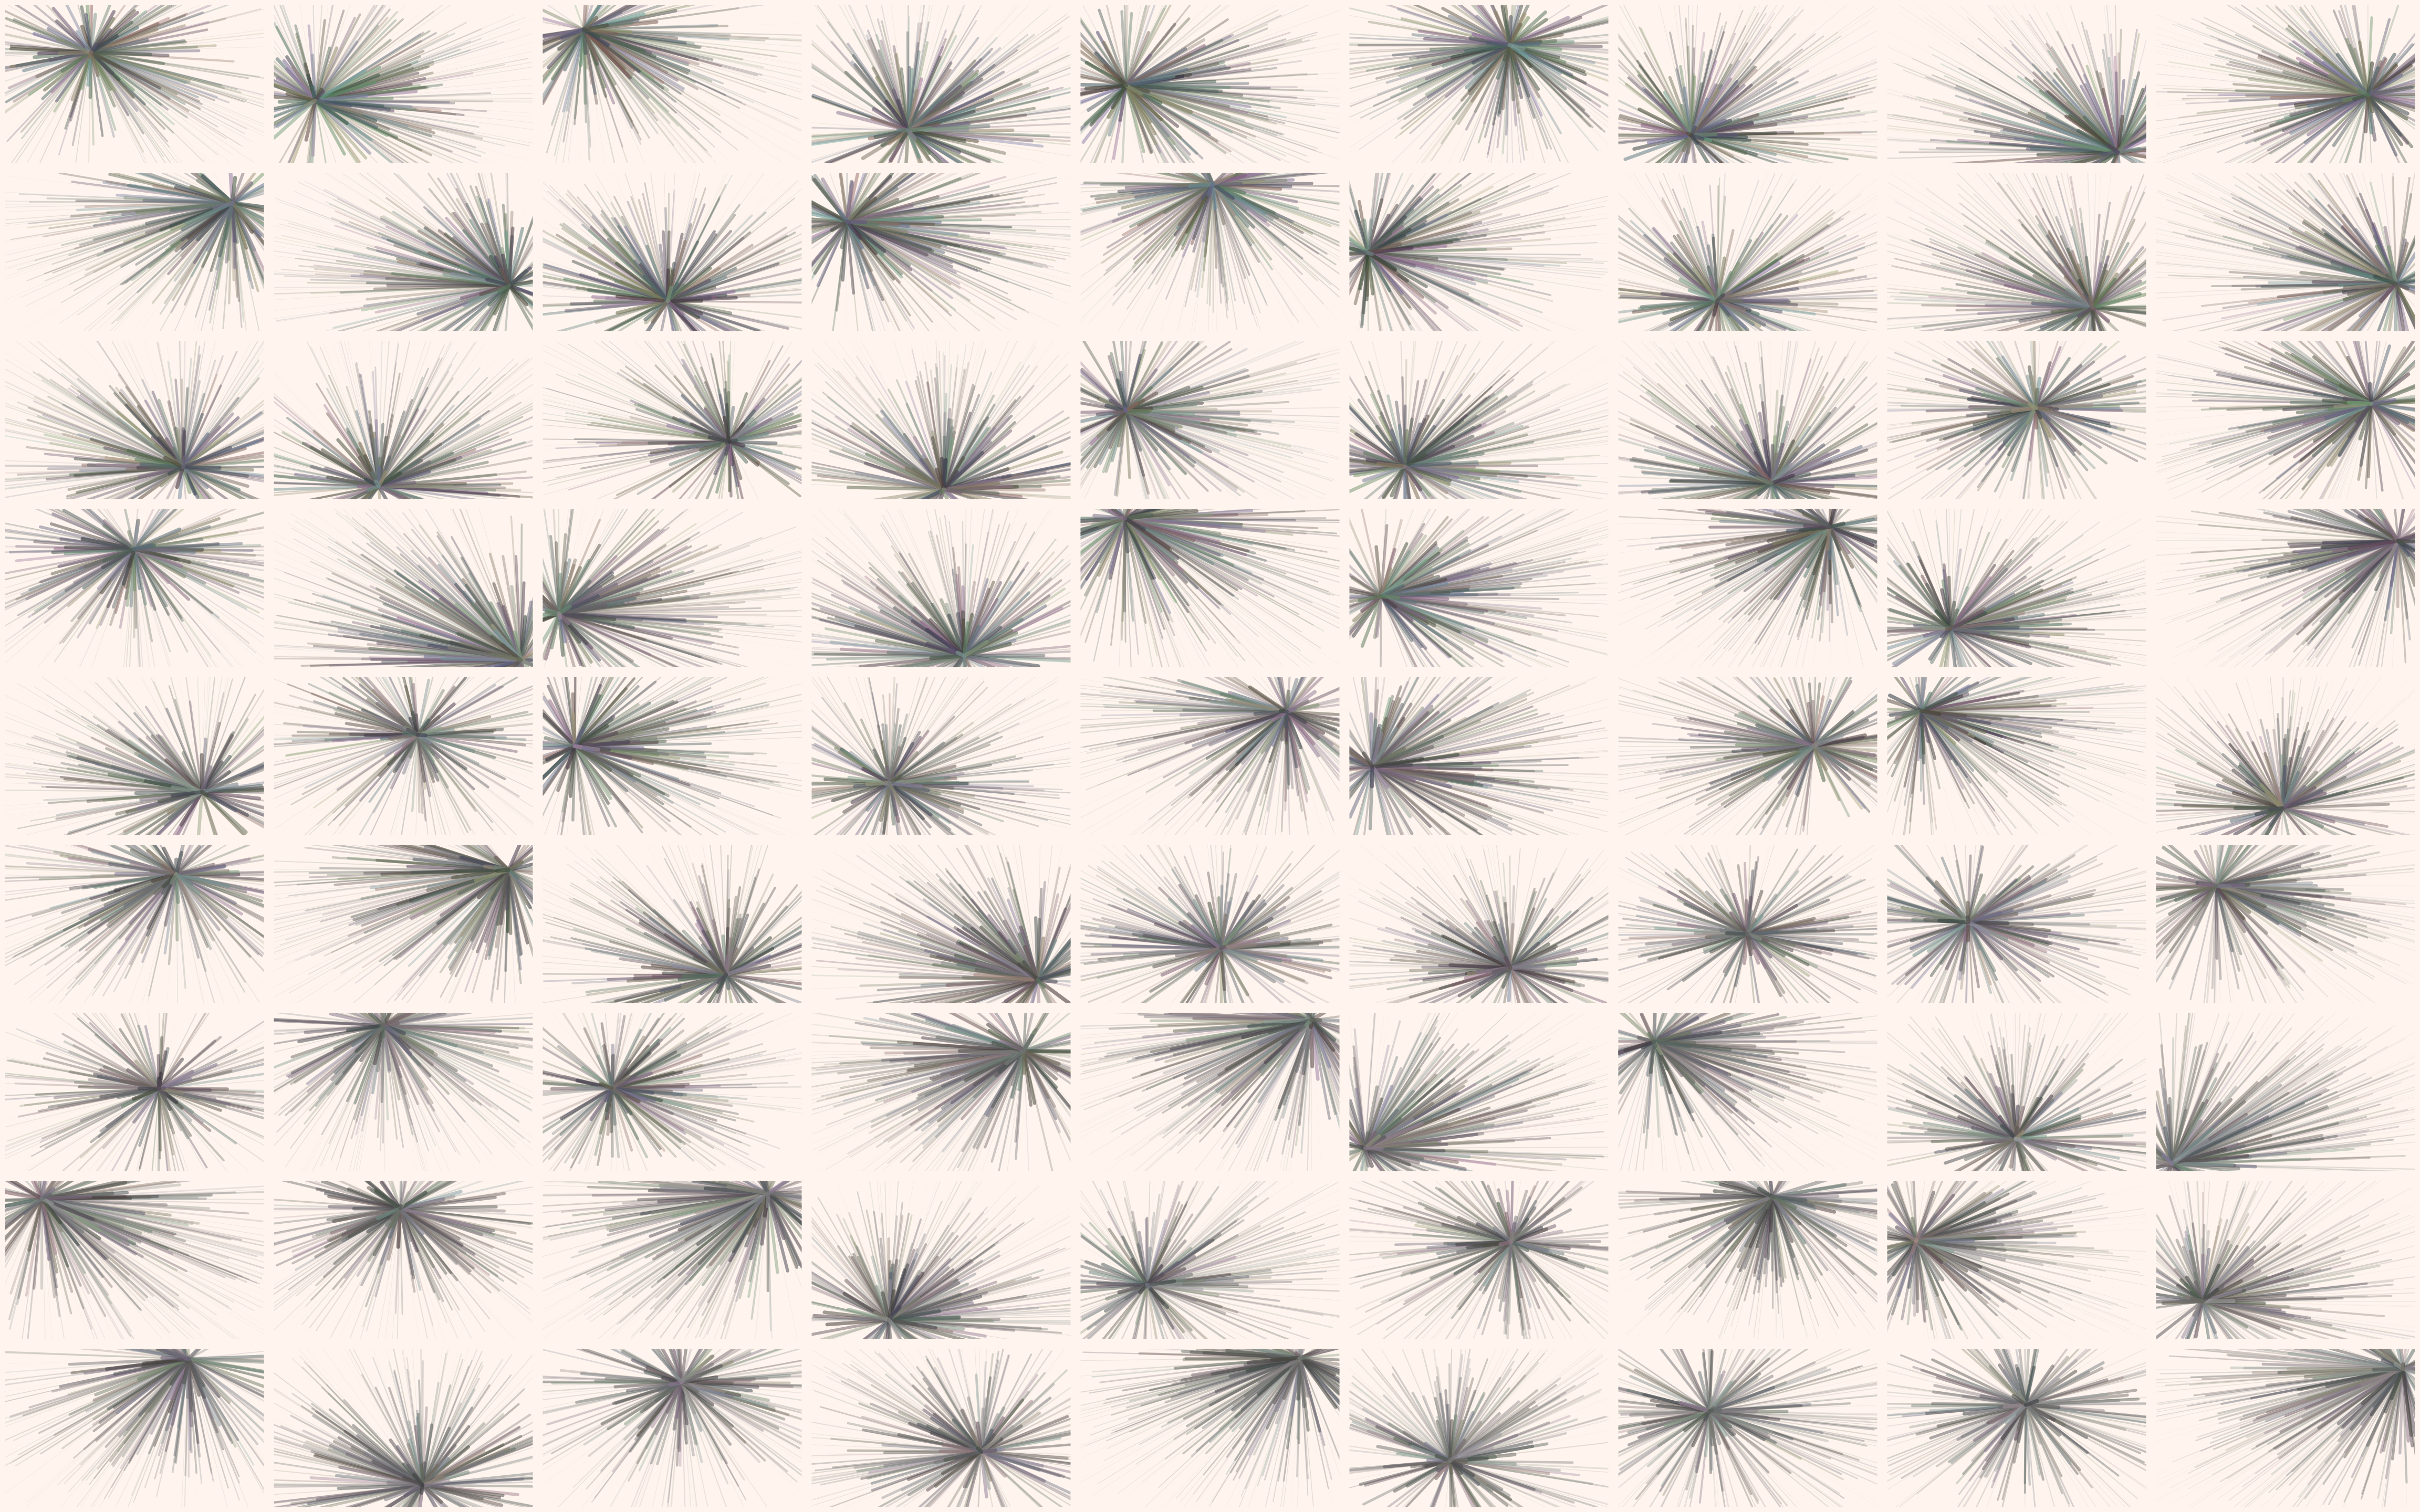
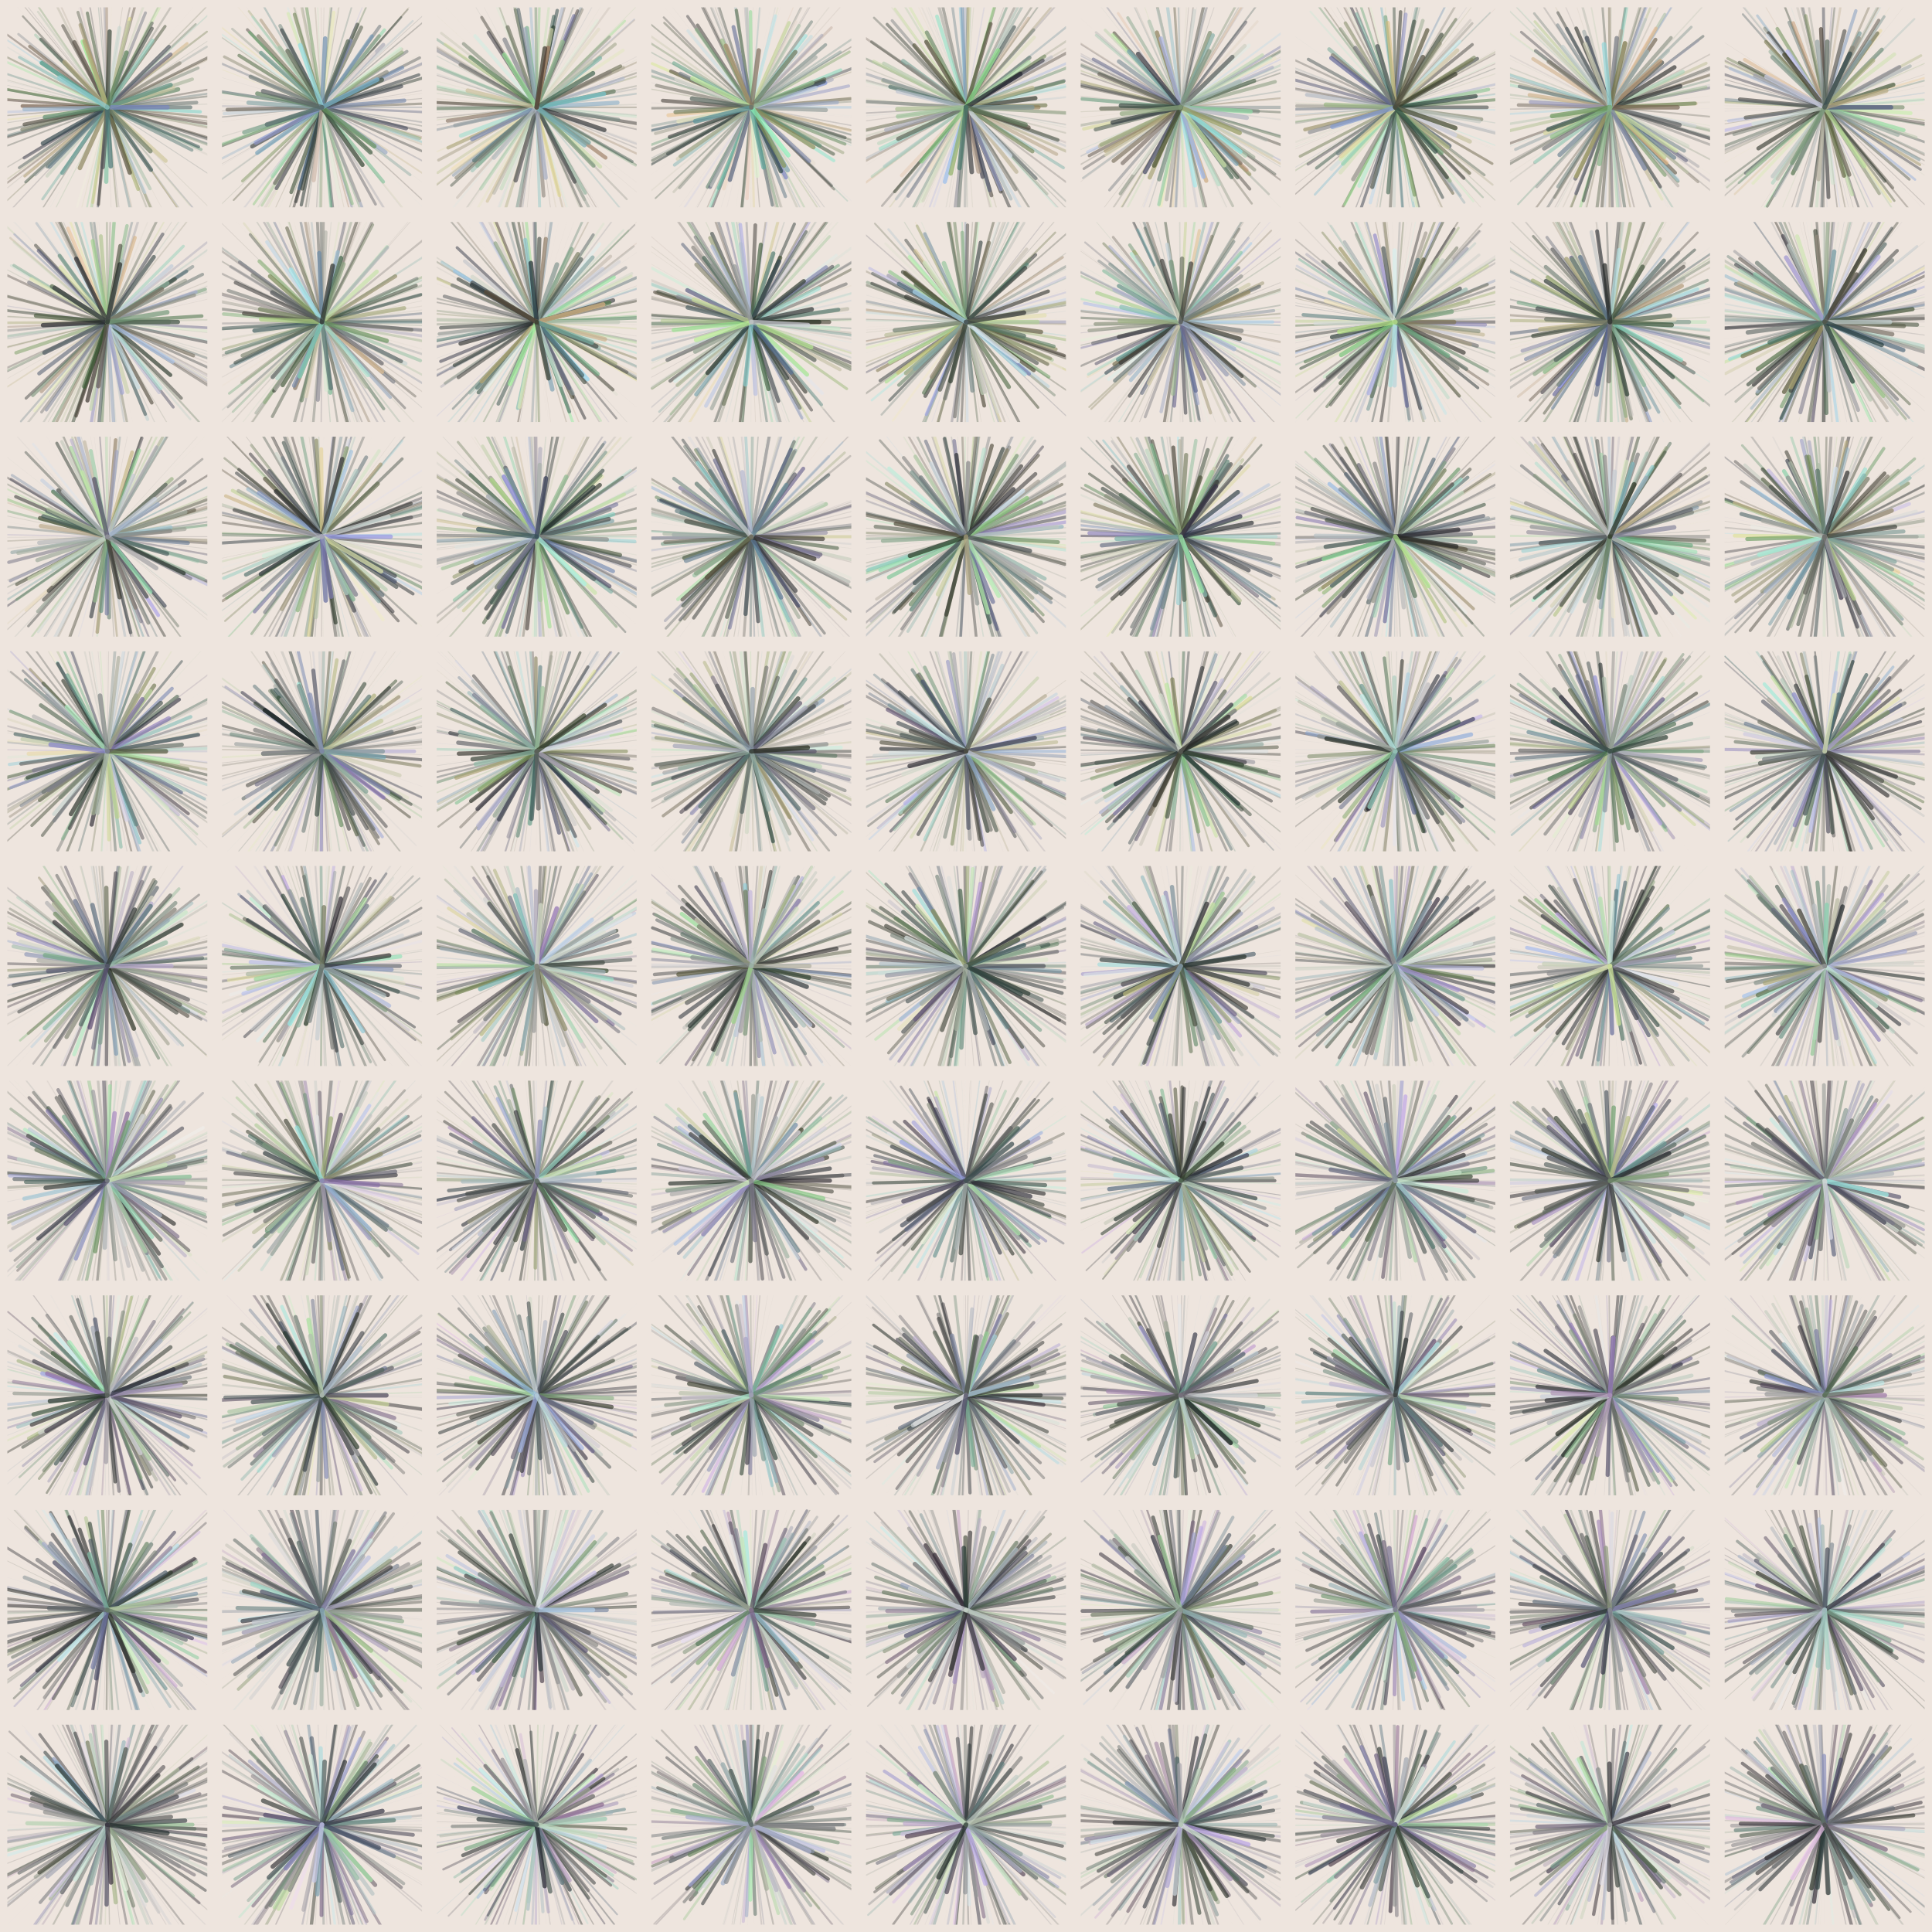
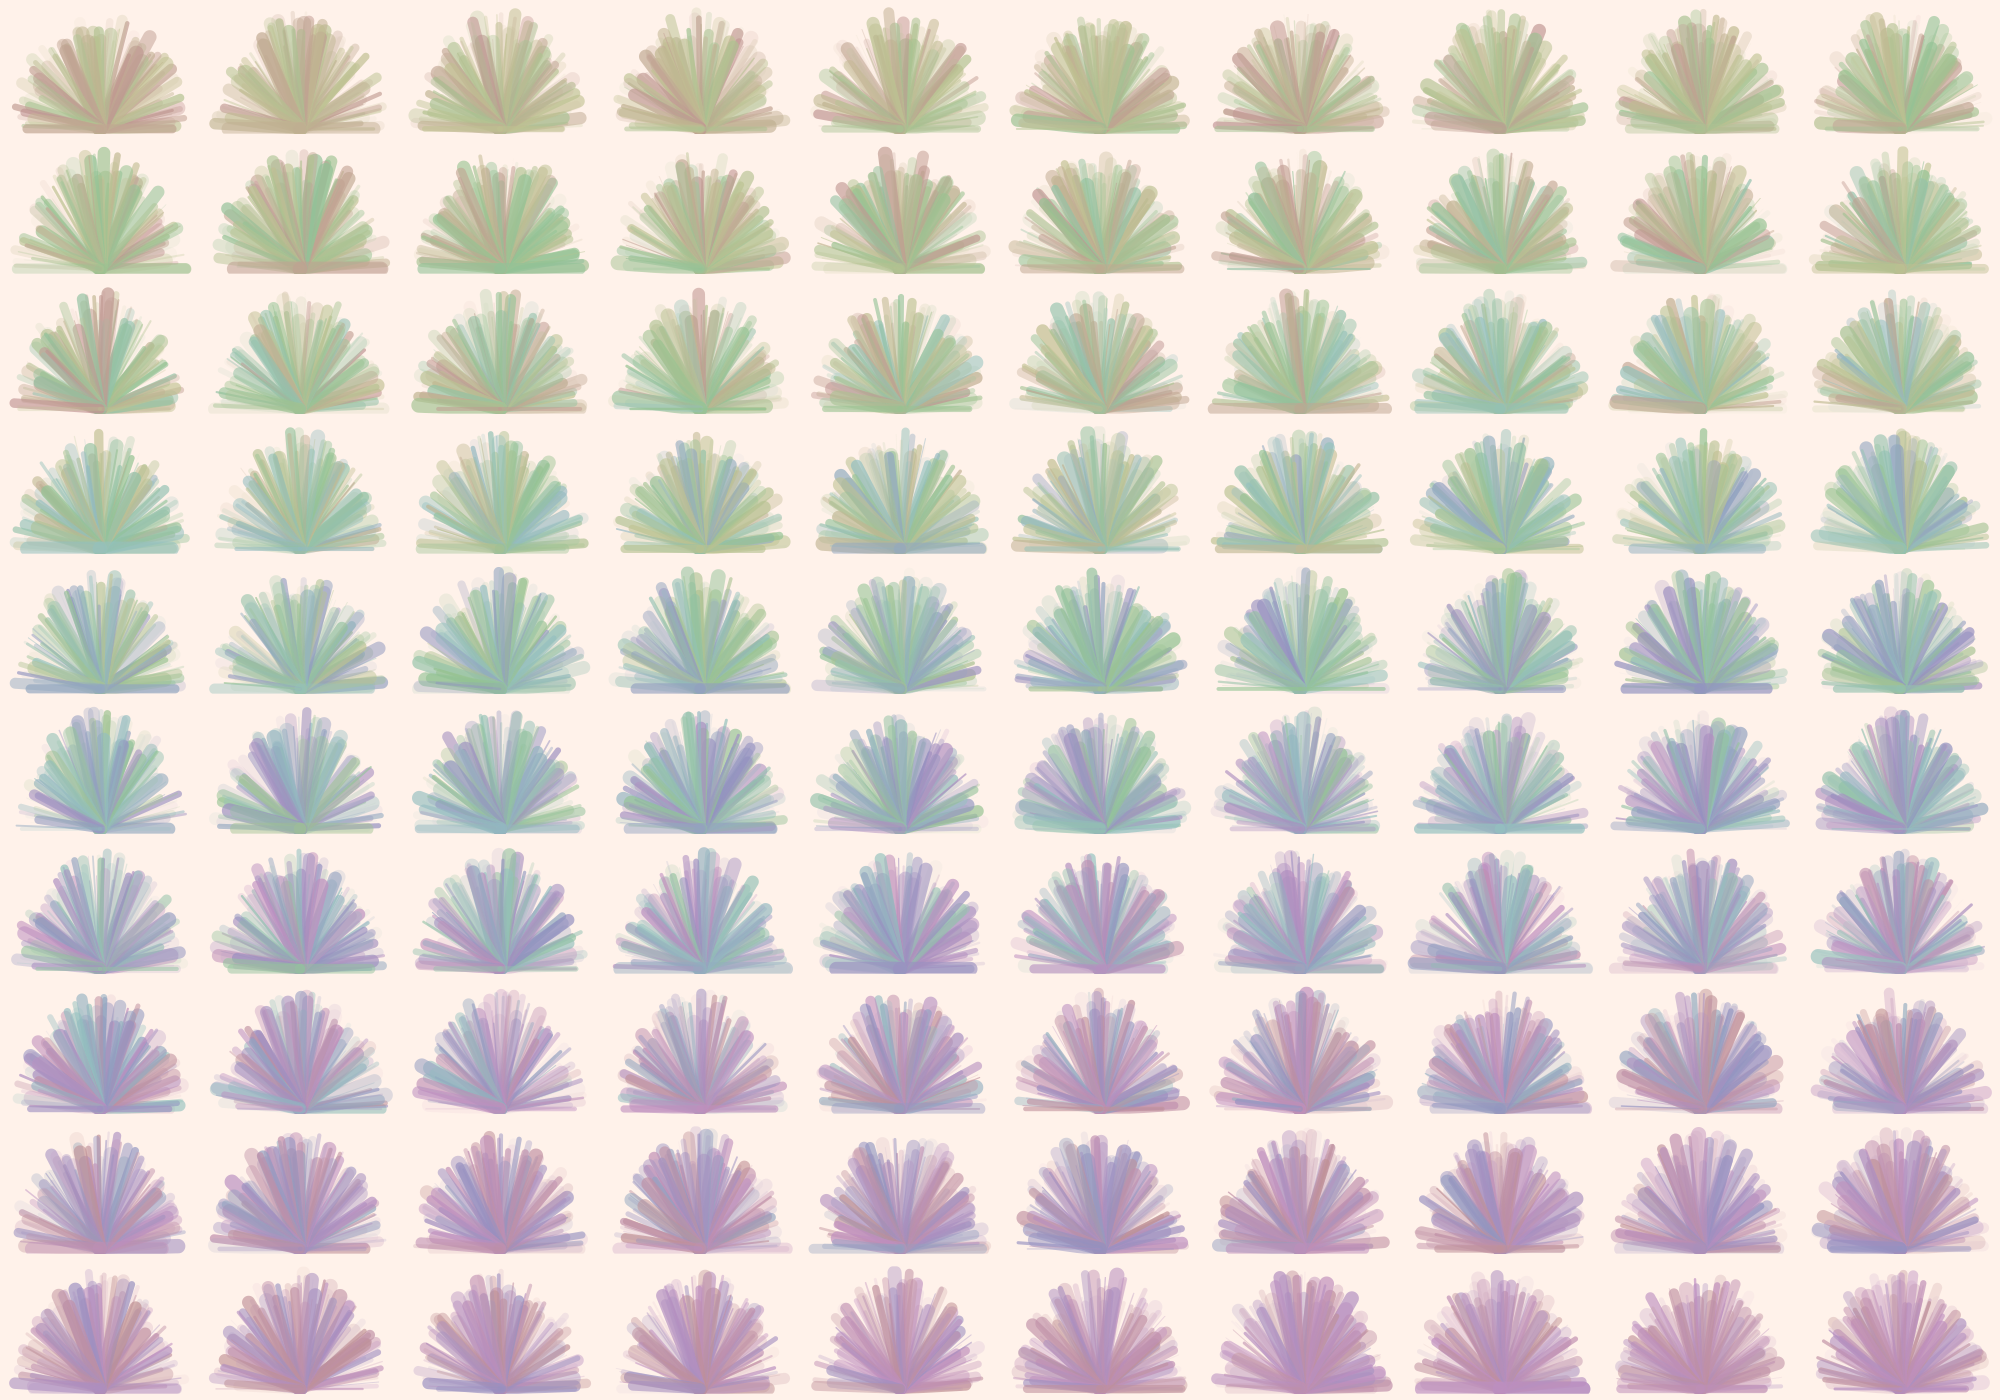
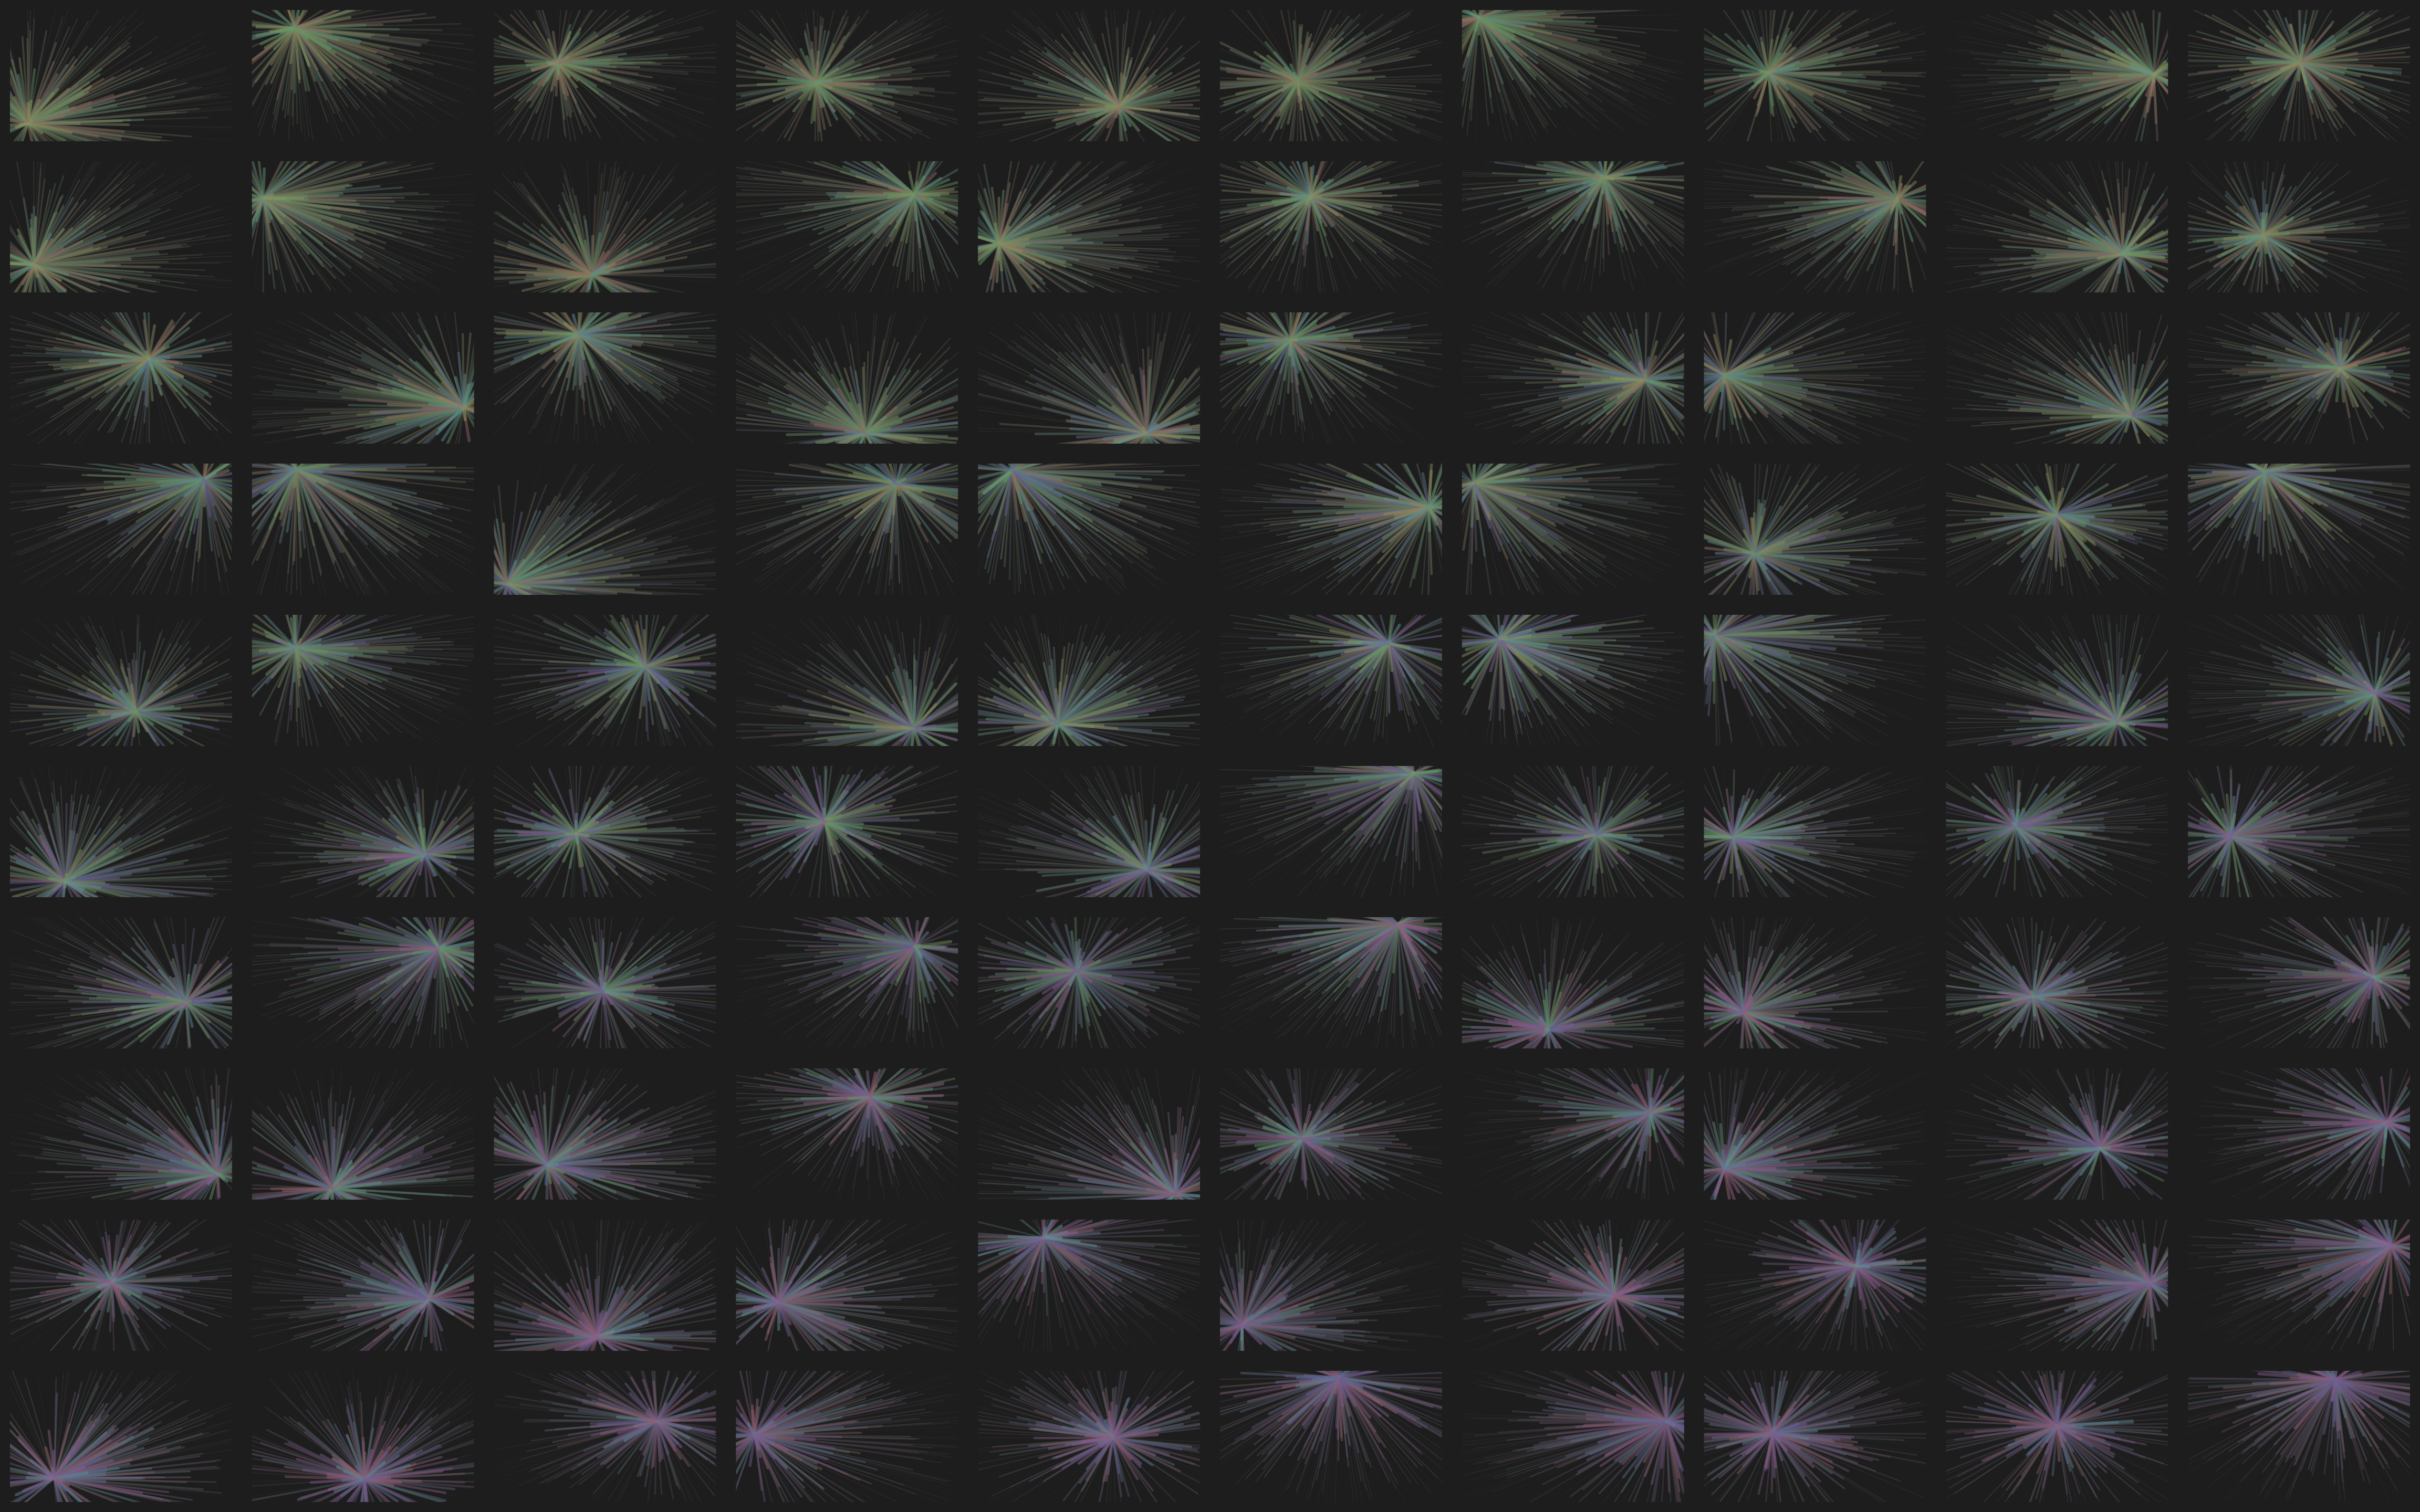
Use printFans() to create a panel of plots all at once.
# build a panel of fans and save it
printFans()
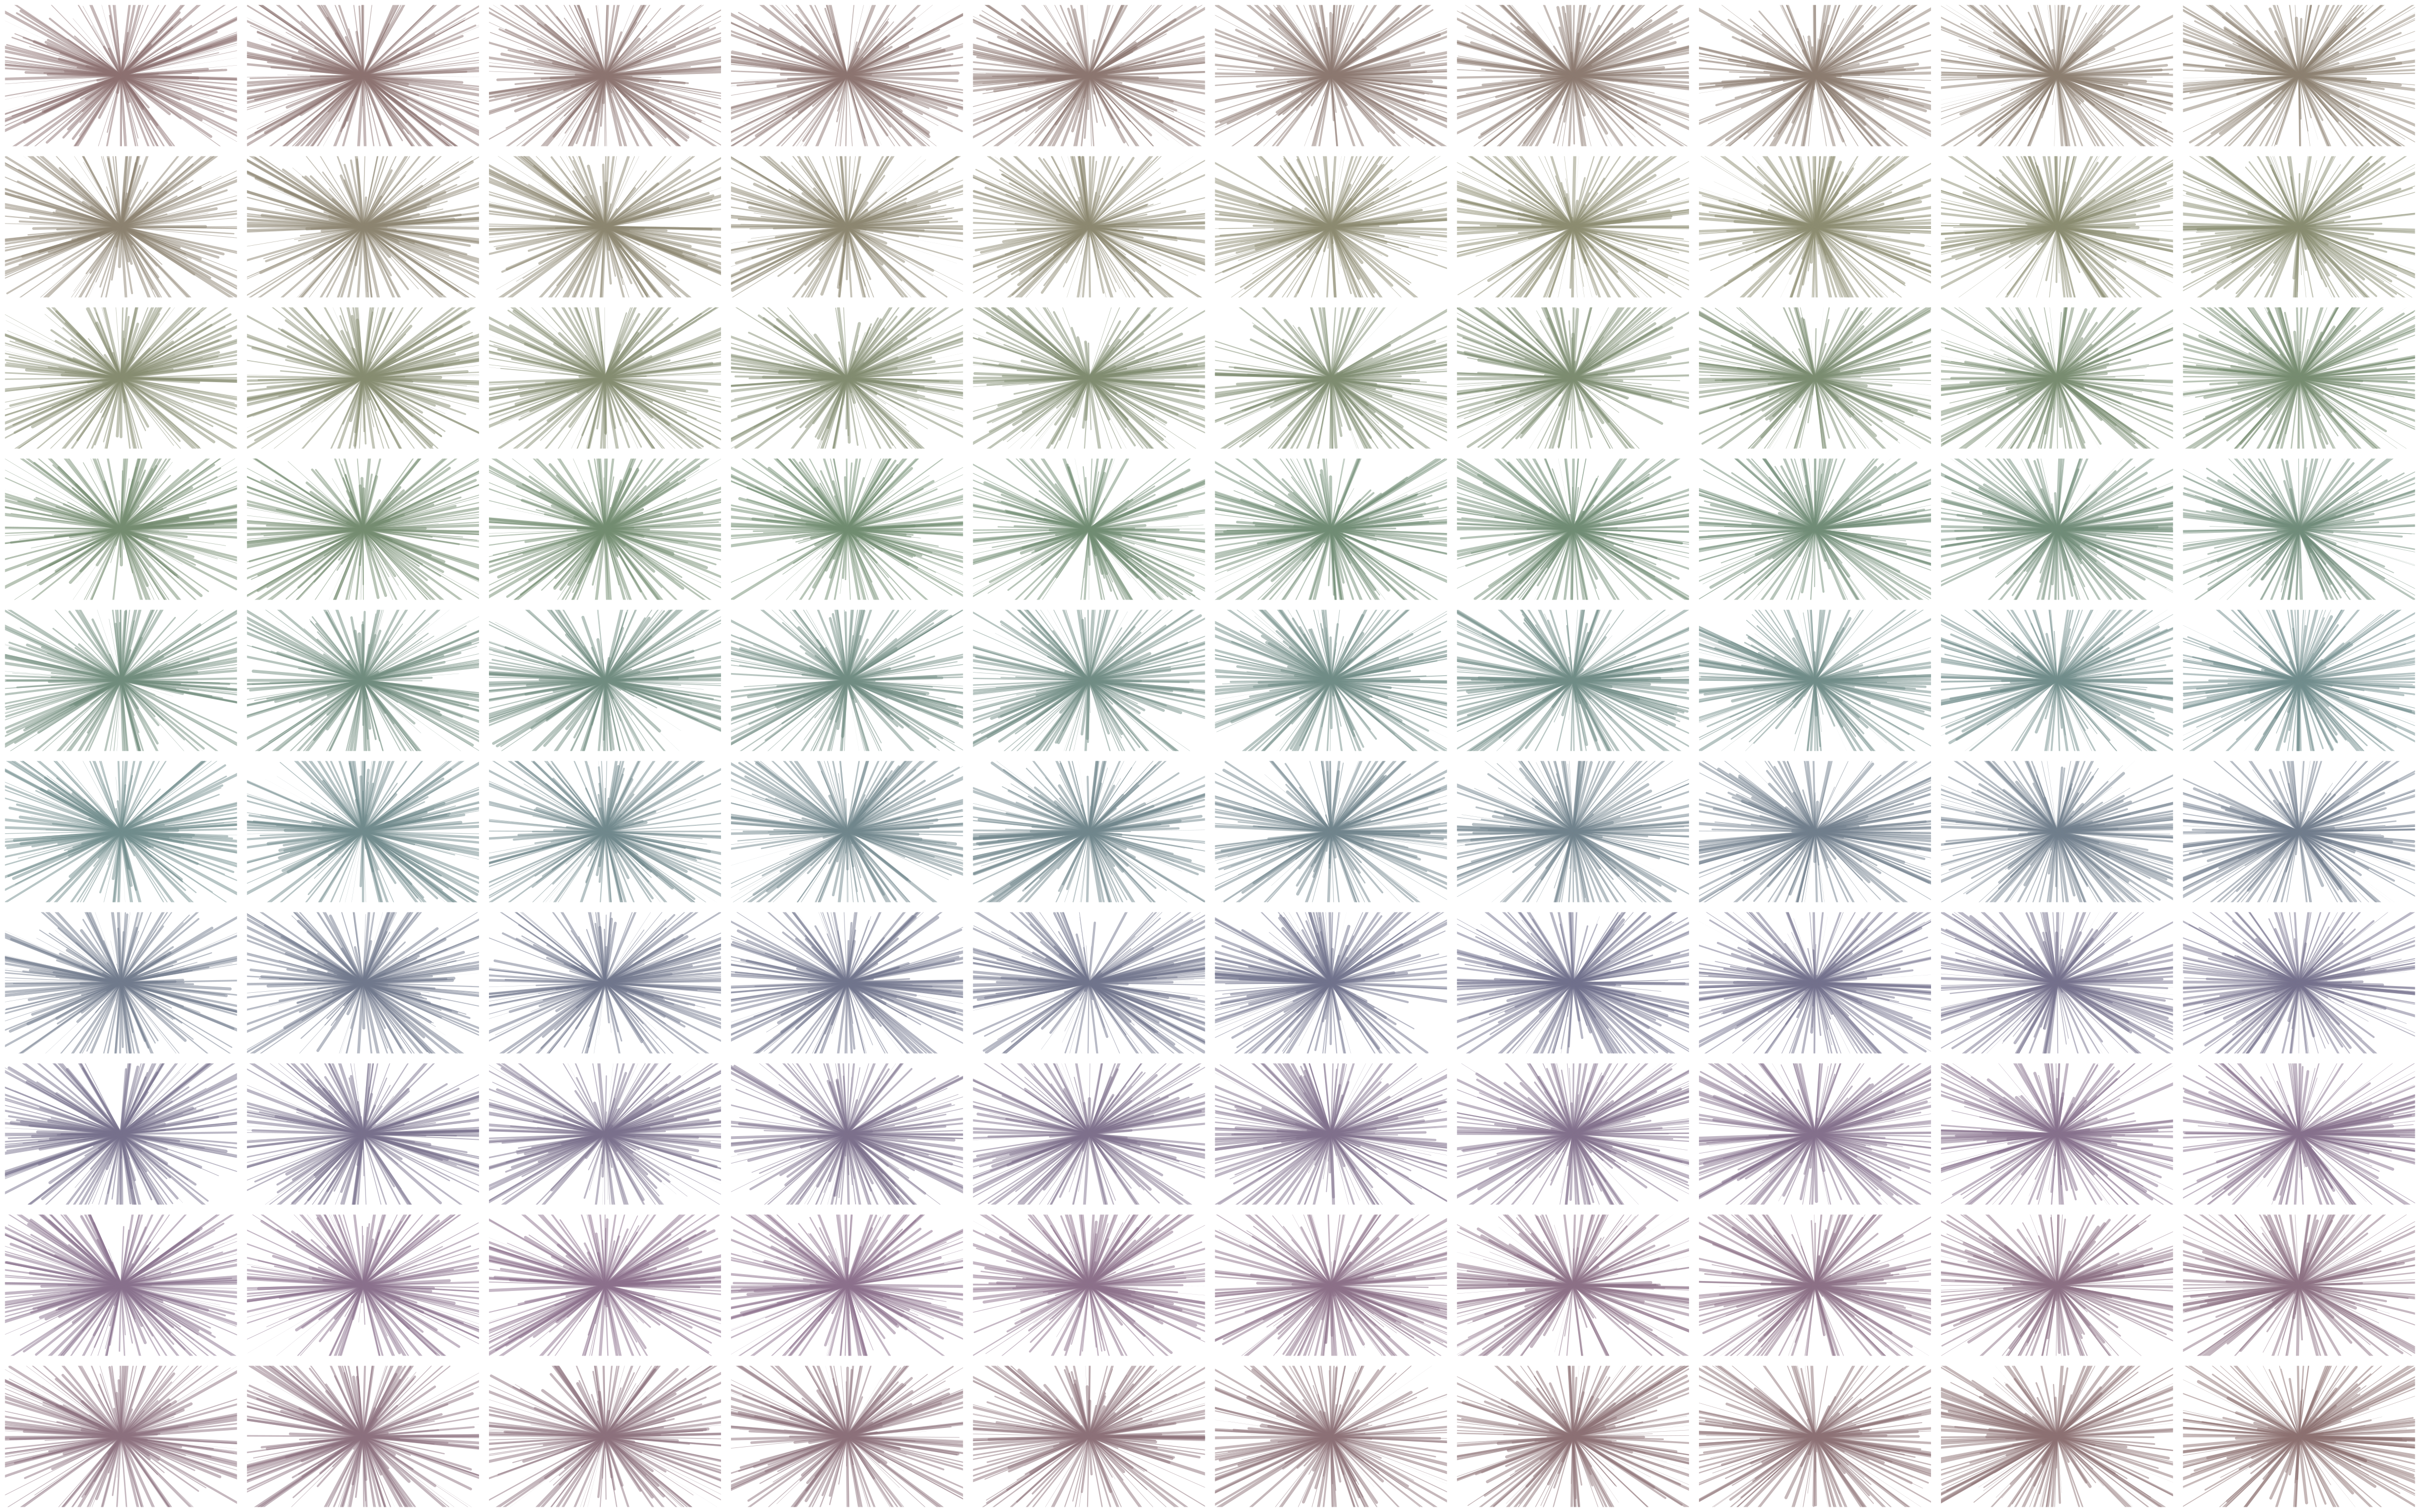
Tweaking the parameters leads to many different effects
2019 September
Find the code here: github.com/joemarlo/Fan-art