Measuring hate speech on social media
Machine learning for the social good
The divisive and polarizing rhetoric in the 2016 presidential election sparked concern over popularizing hateful sentiments towards marginalized populations on Twitter. We analyzed ~100 million tweets spanning 14 years to identify hate speech targeted towards the LGBTQ+ community. We then modeled the prevalence and incidence of hate speech surrounding key political events to test if there was a significant change in the patterns.
Hate speech was identified using dictionary-based methods refined by logistic regression, Naive Bayes, and Recurrent Neural Network (RNN) machine learning classifiers. Interrupted time series and regression discontinuity design were used to quantify the incidence and prevalence of hate speech — the former defined as the change in rate of hate speech and the latter the change in the amount of hate speech in a given time period.
We found no conclusive evidence of changes in prevalence or incidence of hate speech around key events. While some events saw brief upticks in prevalence, overall levels of hate speech remained stable. Our analysis finds exploratory evidence of decreases in incidence of anti-LGBTQ+ hate speech (p < 0.001) over time coinciding with a Twitter policy change allowing users to directly report abuse.
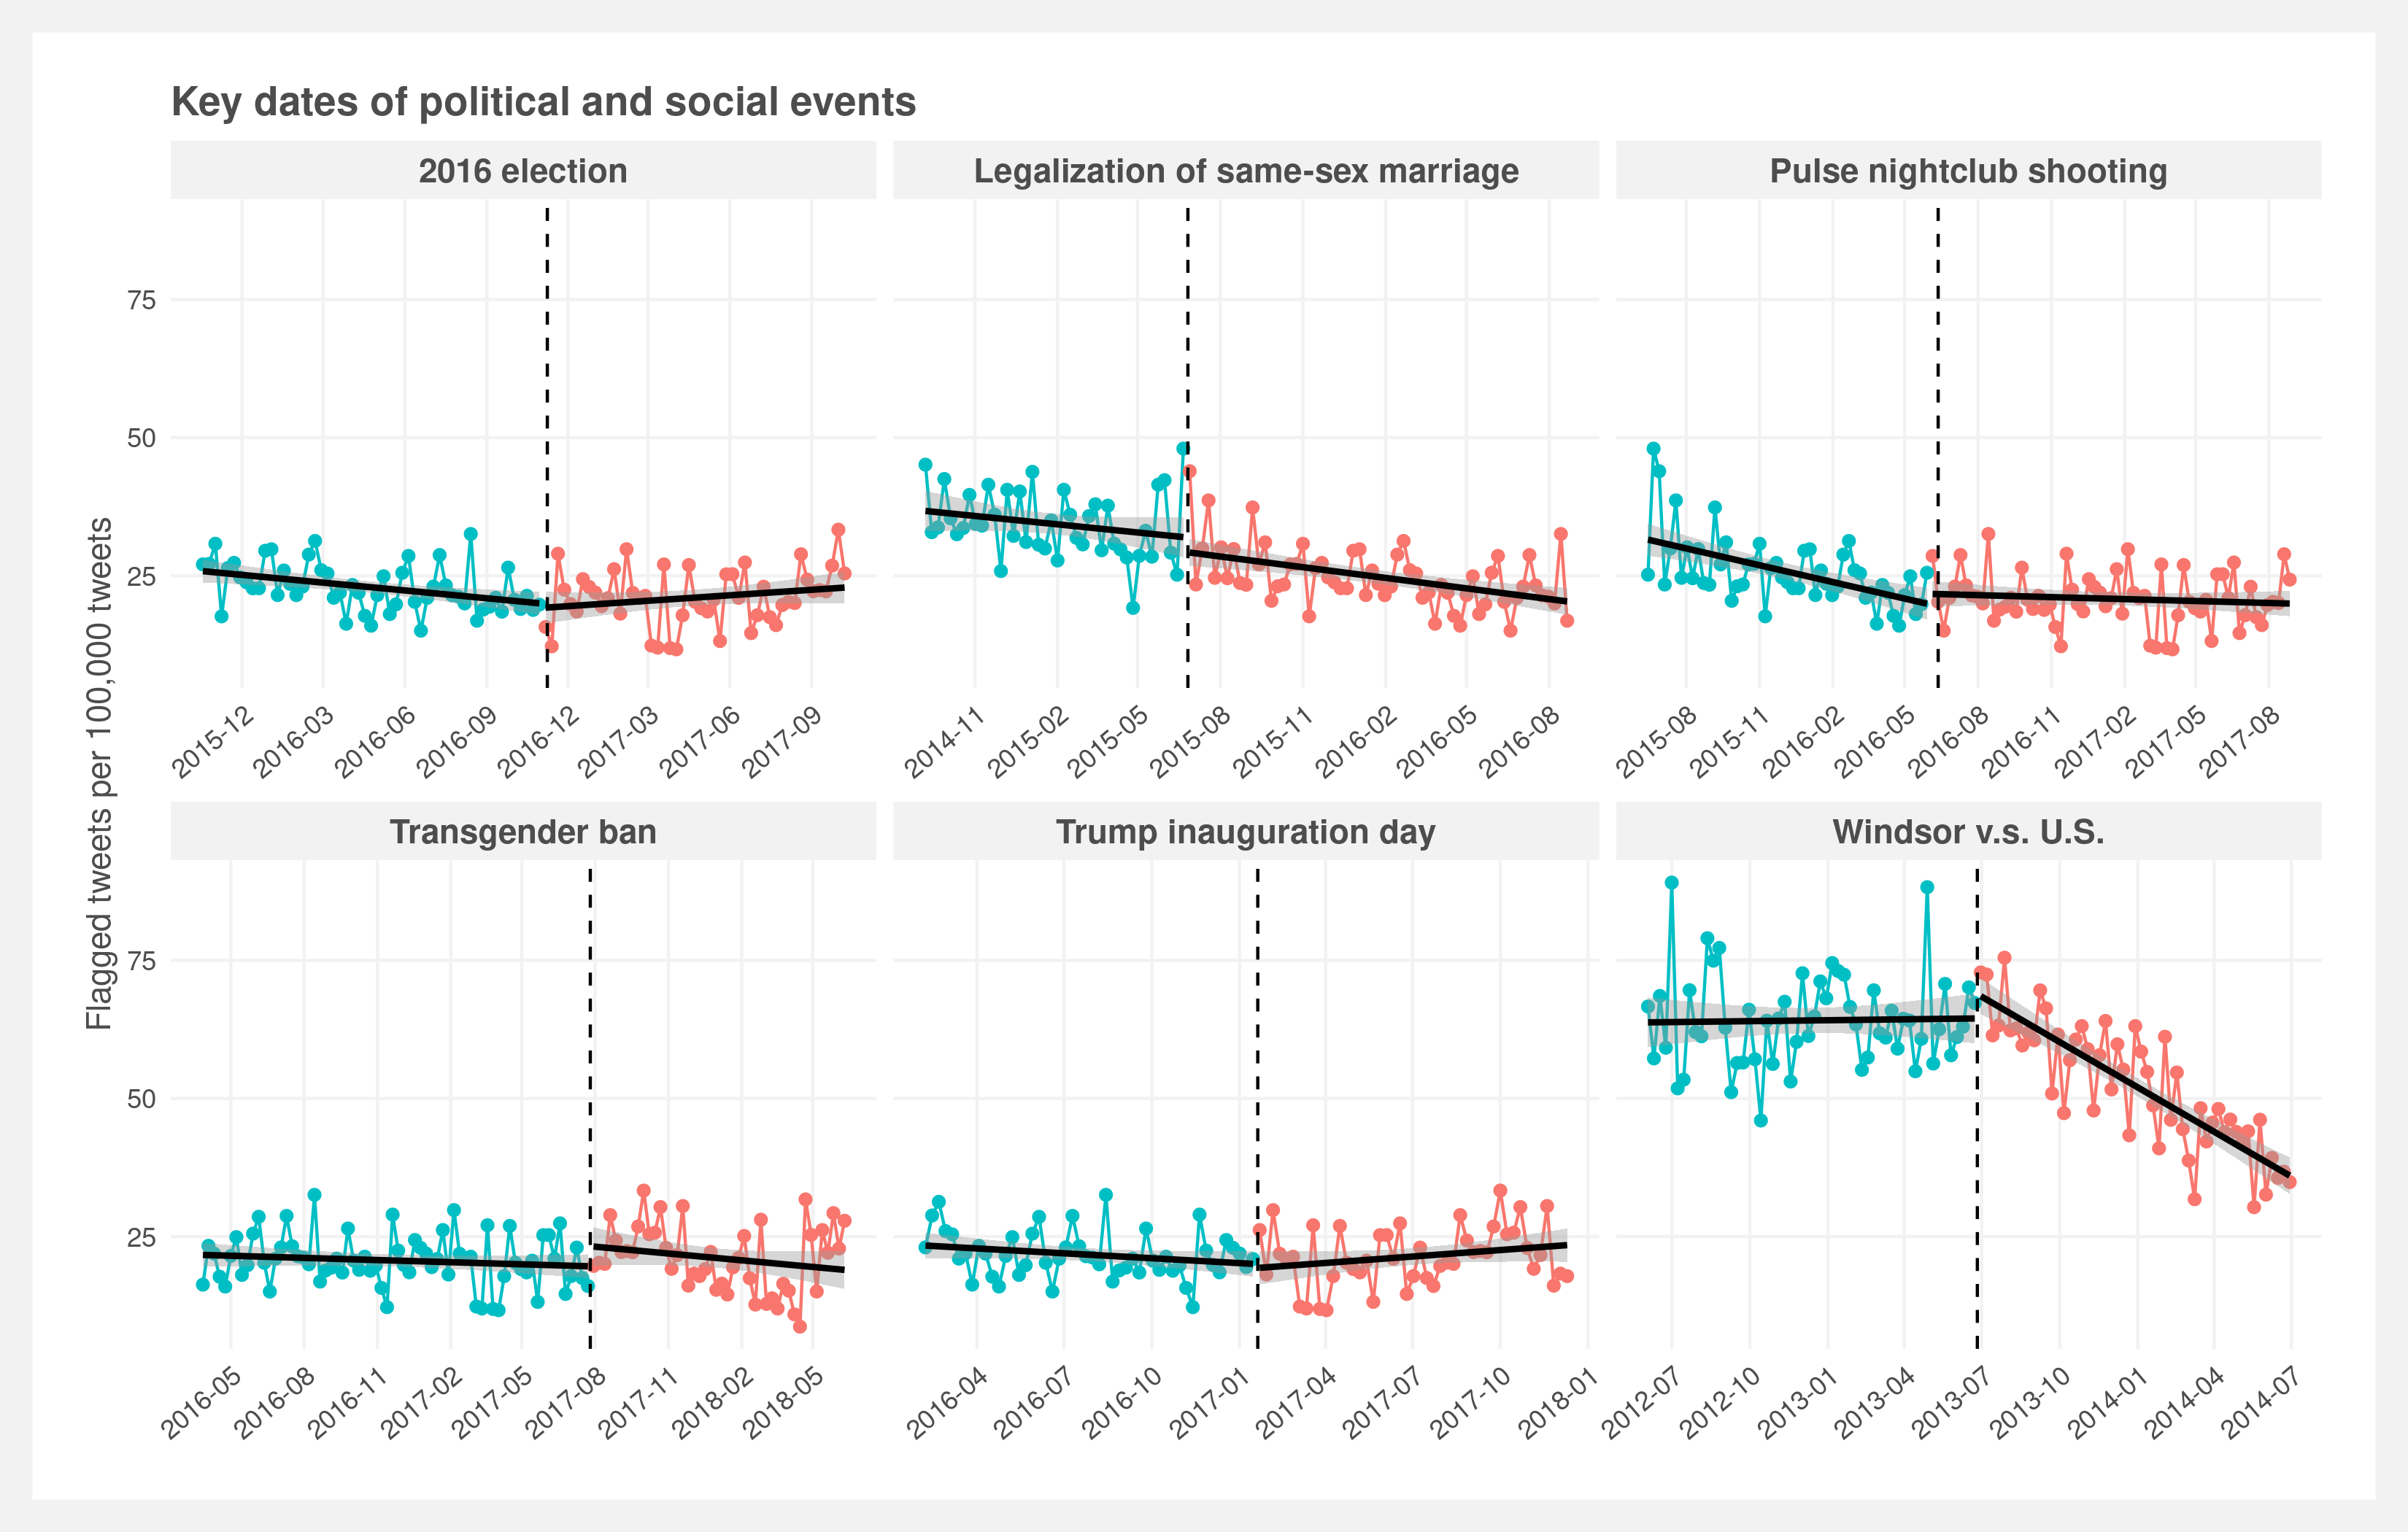
The incidence and prevalence are visualized in the below plot. Incidence is represented by the change in slopes of the regression lines and prevalence by the gap between the two regression lines at the date of interest. The most apparent change — bottom right facet — corresponds to the Windsor vs. United States case decided on June 26, 2013. However, it is confounded by the change in Twitter policy two months later.
This study required a broad range of disciplines. Collecting the tweets necessitated significant programming resources, manually labeling 6,000 tweets involved time management skills, classifying hate speech demanded traditional statistics and data science acumen, and the interrupted time series warranted statistics and domain-specific knowledge. The overall study design was inspired by a similar paper on white nationalist rhetoric by researchers at New York University CSMaP lab.
You can read the paper in its entirety here. A summary of the research follows:
- Collecting tweets: Constructing the dataset
- Classifying hate speech: Dictionary and machine learning classifiers
- Incidence and prevalence: Examining the results over time
- Discussion: Discussion of confounding Twitter policy
- Final thoughts: Conclusion
Collecting tweets
The first challenge was building a suitable dataset. We found no existing datasets that met our requirements; the most burdensome being the size. Our goal was to randomly sample the US population of Twitter users to obtain a representative sample of users and their timelines. The final dataset consists of approximately 100 million tweets spanning 160,000 accounts from 2006 to 2020. Importantly, the tweets are captured by first identifying users and then collecting their tweet history (i.e. their timeline) rather than collecting tweets regardless of user.
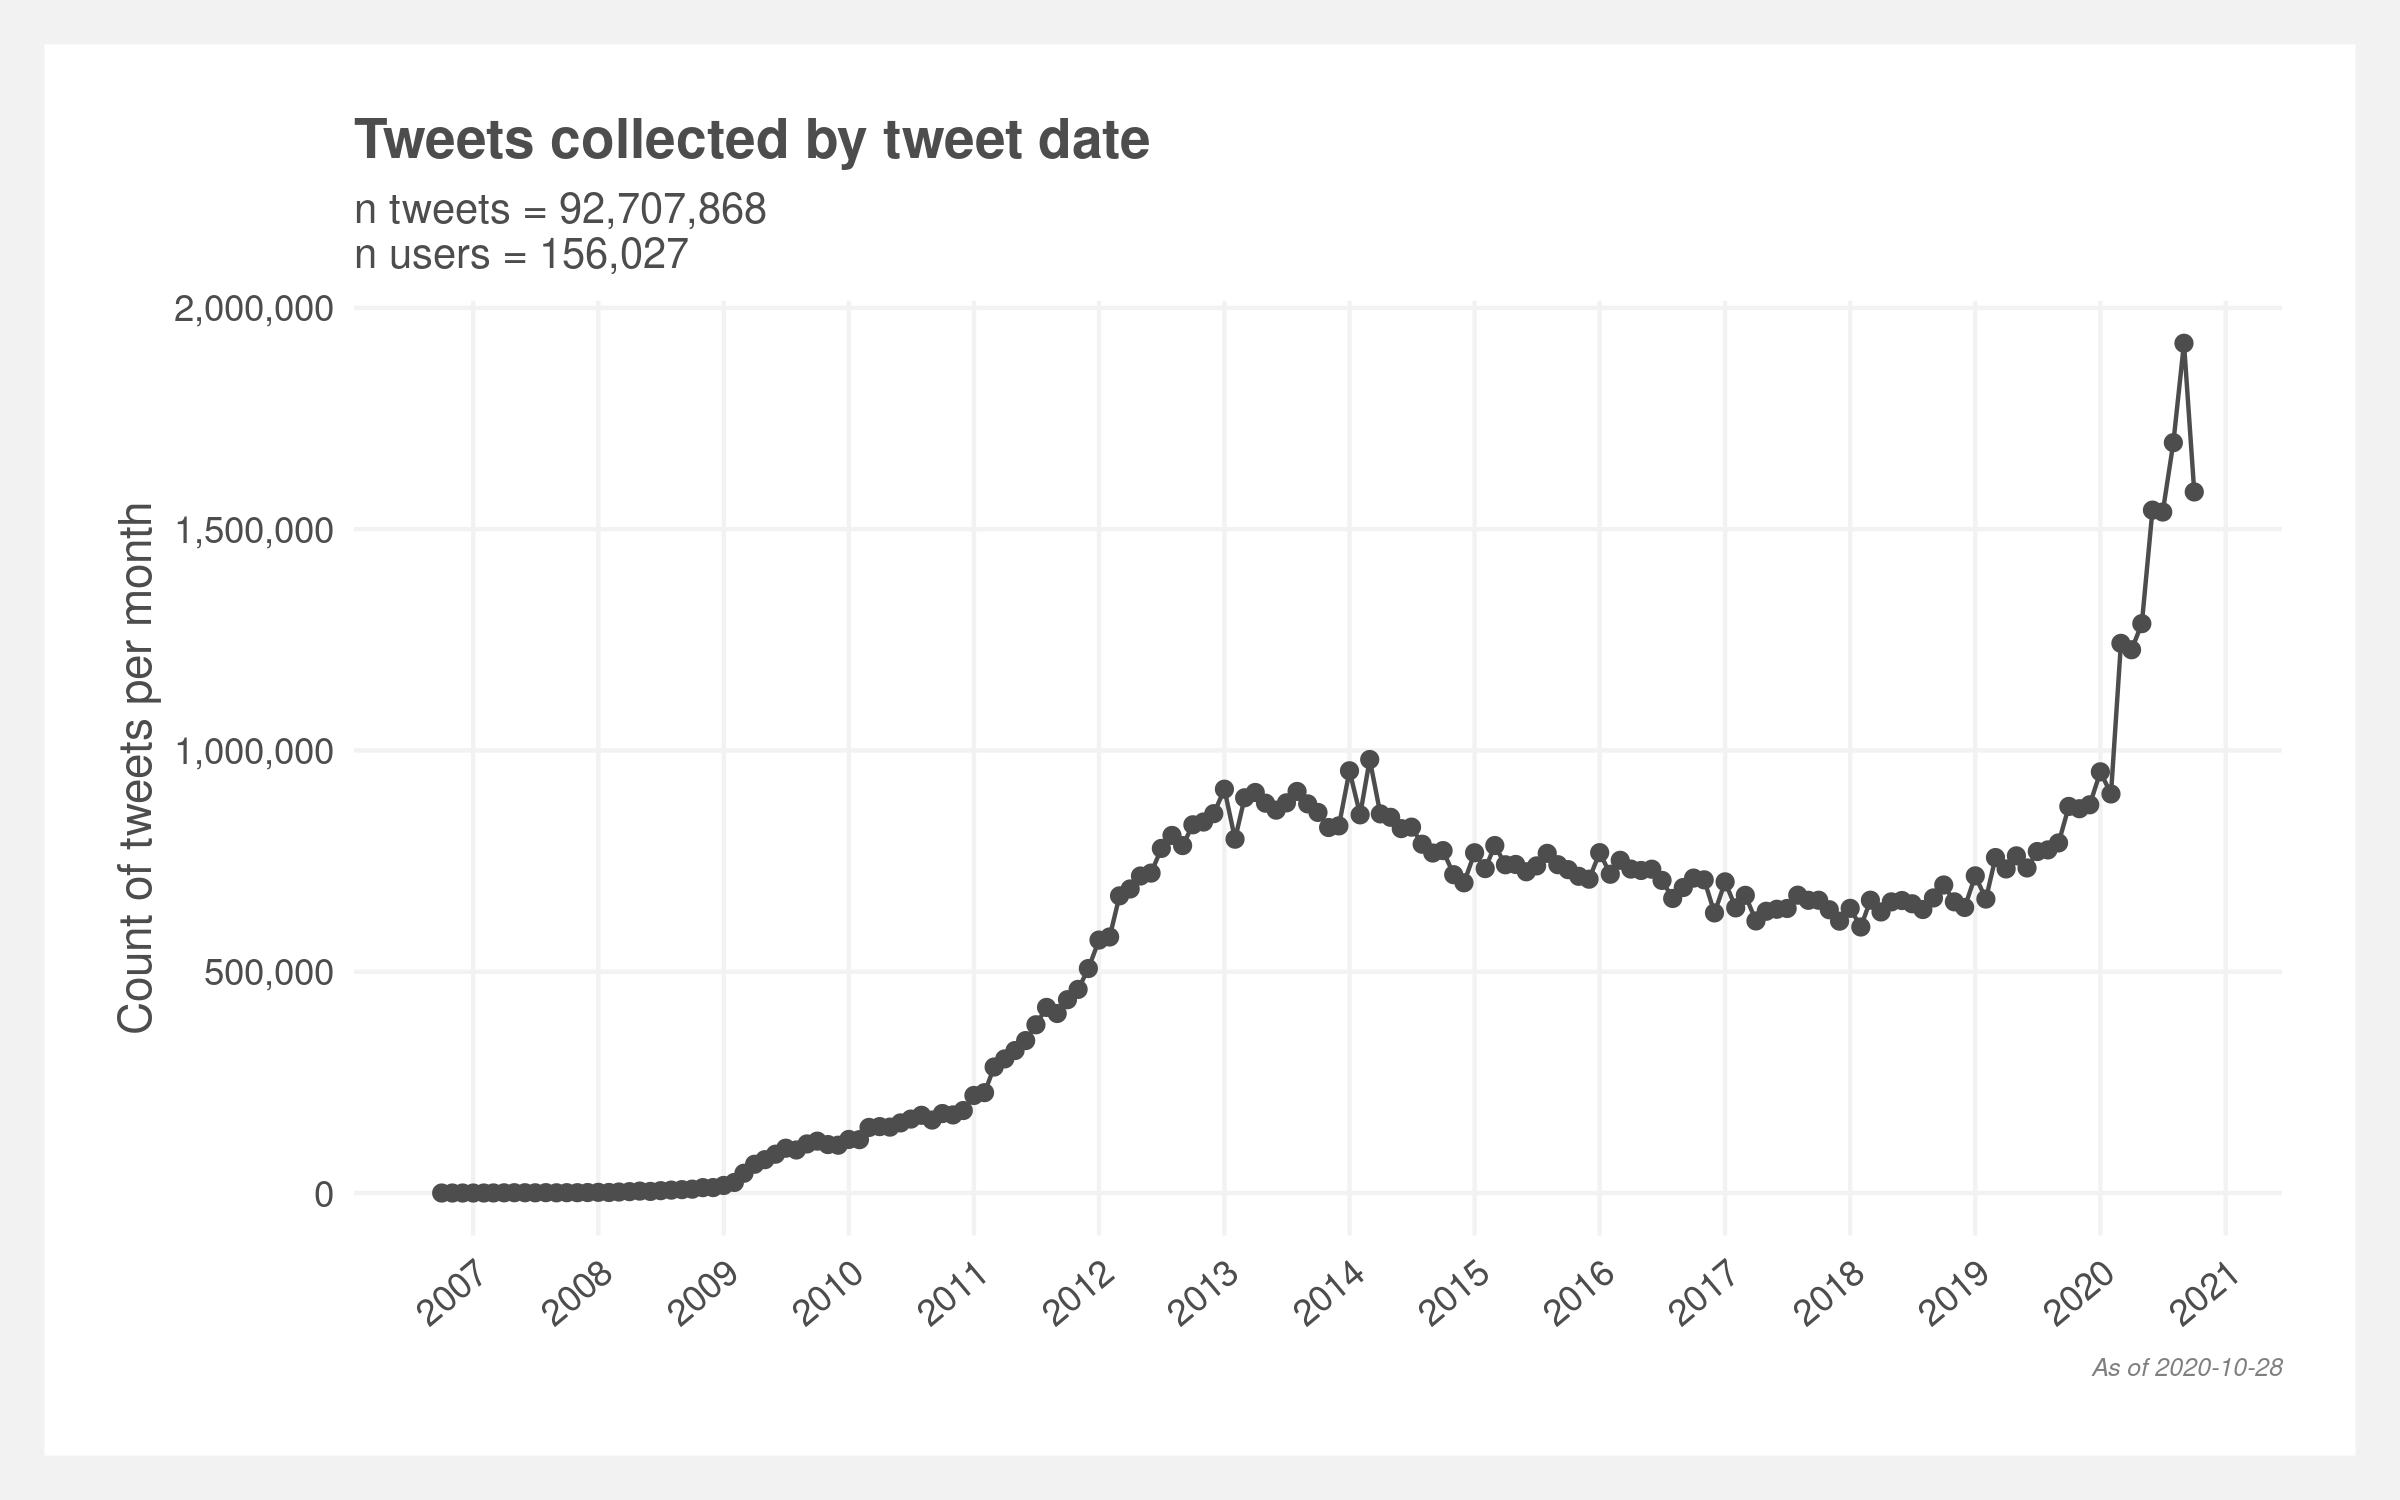
A simple random sample is not possible due to technical limitations which causes our sampling plan to contain a known bias. The sample is random but only within a known portion of the unknown total population. The below plot illustrates the frequency of collected tweets plateaus in 2013 and then starts increasing in 2020 rather than monotonically increasing over time with Twitter popularity. The associated accounts appear to skew towards 2012-2014 account opening dates (derived from the first known tweet) which may explain the plateau. The latter increase is most likely due to a limitation of being able to collect only the latest 3,240 tweets from a given user.
The sampling was executed through the Twitter API via the Tweepy library. The Twitter API limits API calls to 900 per 15 minutes which severely elongates the required time to pull enough tweets. A Python script executed on a Raspberry Pi microcomputer was used to continuously make API calls for approximately 25 days and store the resulting data in a SQLite database.
Classifying hate speech
Identifying hate speech is a two-step process. First, tweets containing key words are flagged and then a machine learning classifier parses the true from the false positives. The first step greatly reduces the required amount of tweets to be manually labeled during the construction of the training set.
First step: dictionary
There is no universally accepted definition of hate speech, as academics and policymakers vary in their interpretations of what constitutes hate. We established an operational definition of hate speech and focused on defining hate speech with a broad interpretation, in order to cover a variety of messages and expressions that target and justify hate towards the LGBTQ+ population.
A dictionary of terms and phrases that are associated with LGBTQ+ hate speech was built. We consulted Hatebase — an active database containing a lexicon of terms identified by internet users as hate speech.
Regex pattern matching was used to flag tweets that contained language that resembled the pre-selected terms in the lexicon. Of the 92 million collected tweets 167,724 (0.18%) were identified as potential incidents of LGBTQ+ directed slurs. This approach offers a crude approximation of instances of anti-LGBTQ+ speech. Notably, this approach is not able to separate tweets that explicitly condemn the use of anti-LGBTQ+ language from true incidents of slurs.
Second step: modeling
Several machine learning models were fit to disentangle true instances of anti-LGBTQ+ tweets from false positives identified by the regex. Prior to model fitting, 6,000 tweets were randomly sampled from the 167,724 tweets flagged in the first step. These 6,000 were coded by the three authors. The coding scheme identified each of the 6,000 tweets as either a true instance of anti-LGBTQ+ language or as a false positive. These labels were then used as training data for logistic regression word embeddings, Naive Bayes and RNN machine learning models. Of the 6,000 labeled tweets, 10% were removed and saved to assess out of sample accuracy while the remaining were used to train each of the candidate models outlined below.
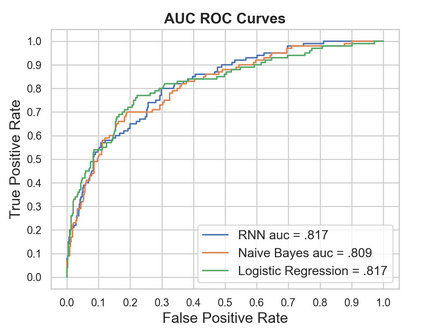
Of the three candidate models, we selected the RNN due to its balance in recall and precision. Moreover, as more labeled training tweets are obtained (in further studies), the predictive power of the RNN will increase. The RNN model identified 32,554 tweets or 0.035% of the sample as containing anti-LGBTQ+ language. This is the equivalent of 35 in 100,000 tweets.
| Model | Precision | Recall |
|---|---|---|
| RNN | 0.53 | 0.56 |
| Naive Bayes | 0.66 | 0.23 |
| Logistic regression | 0.66 | 0.39 |
Incidence and prevalence
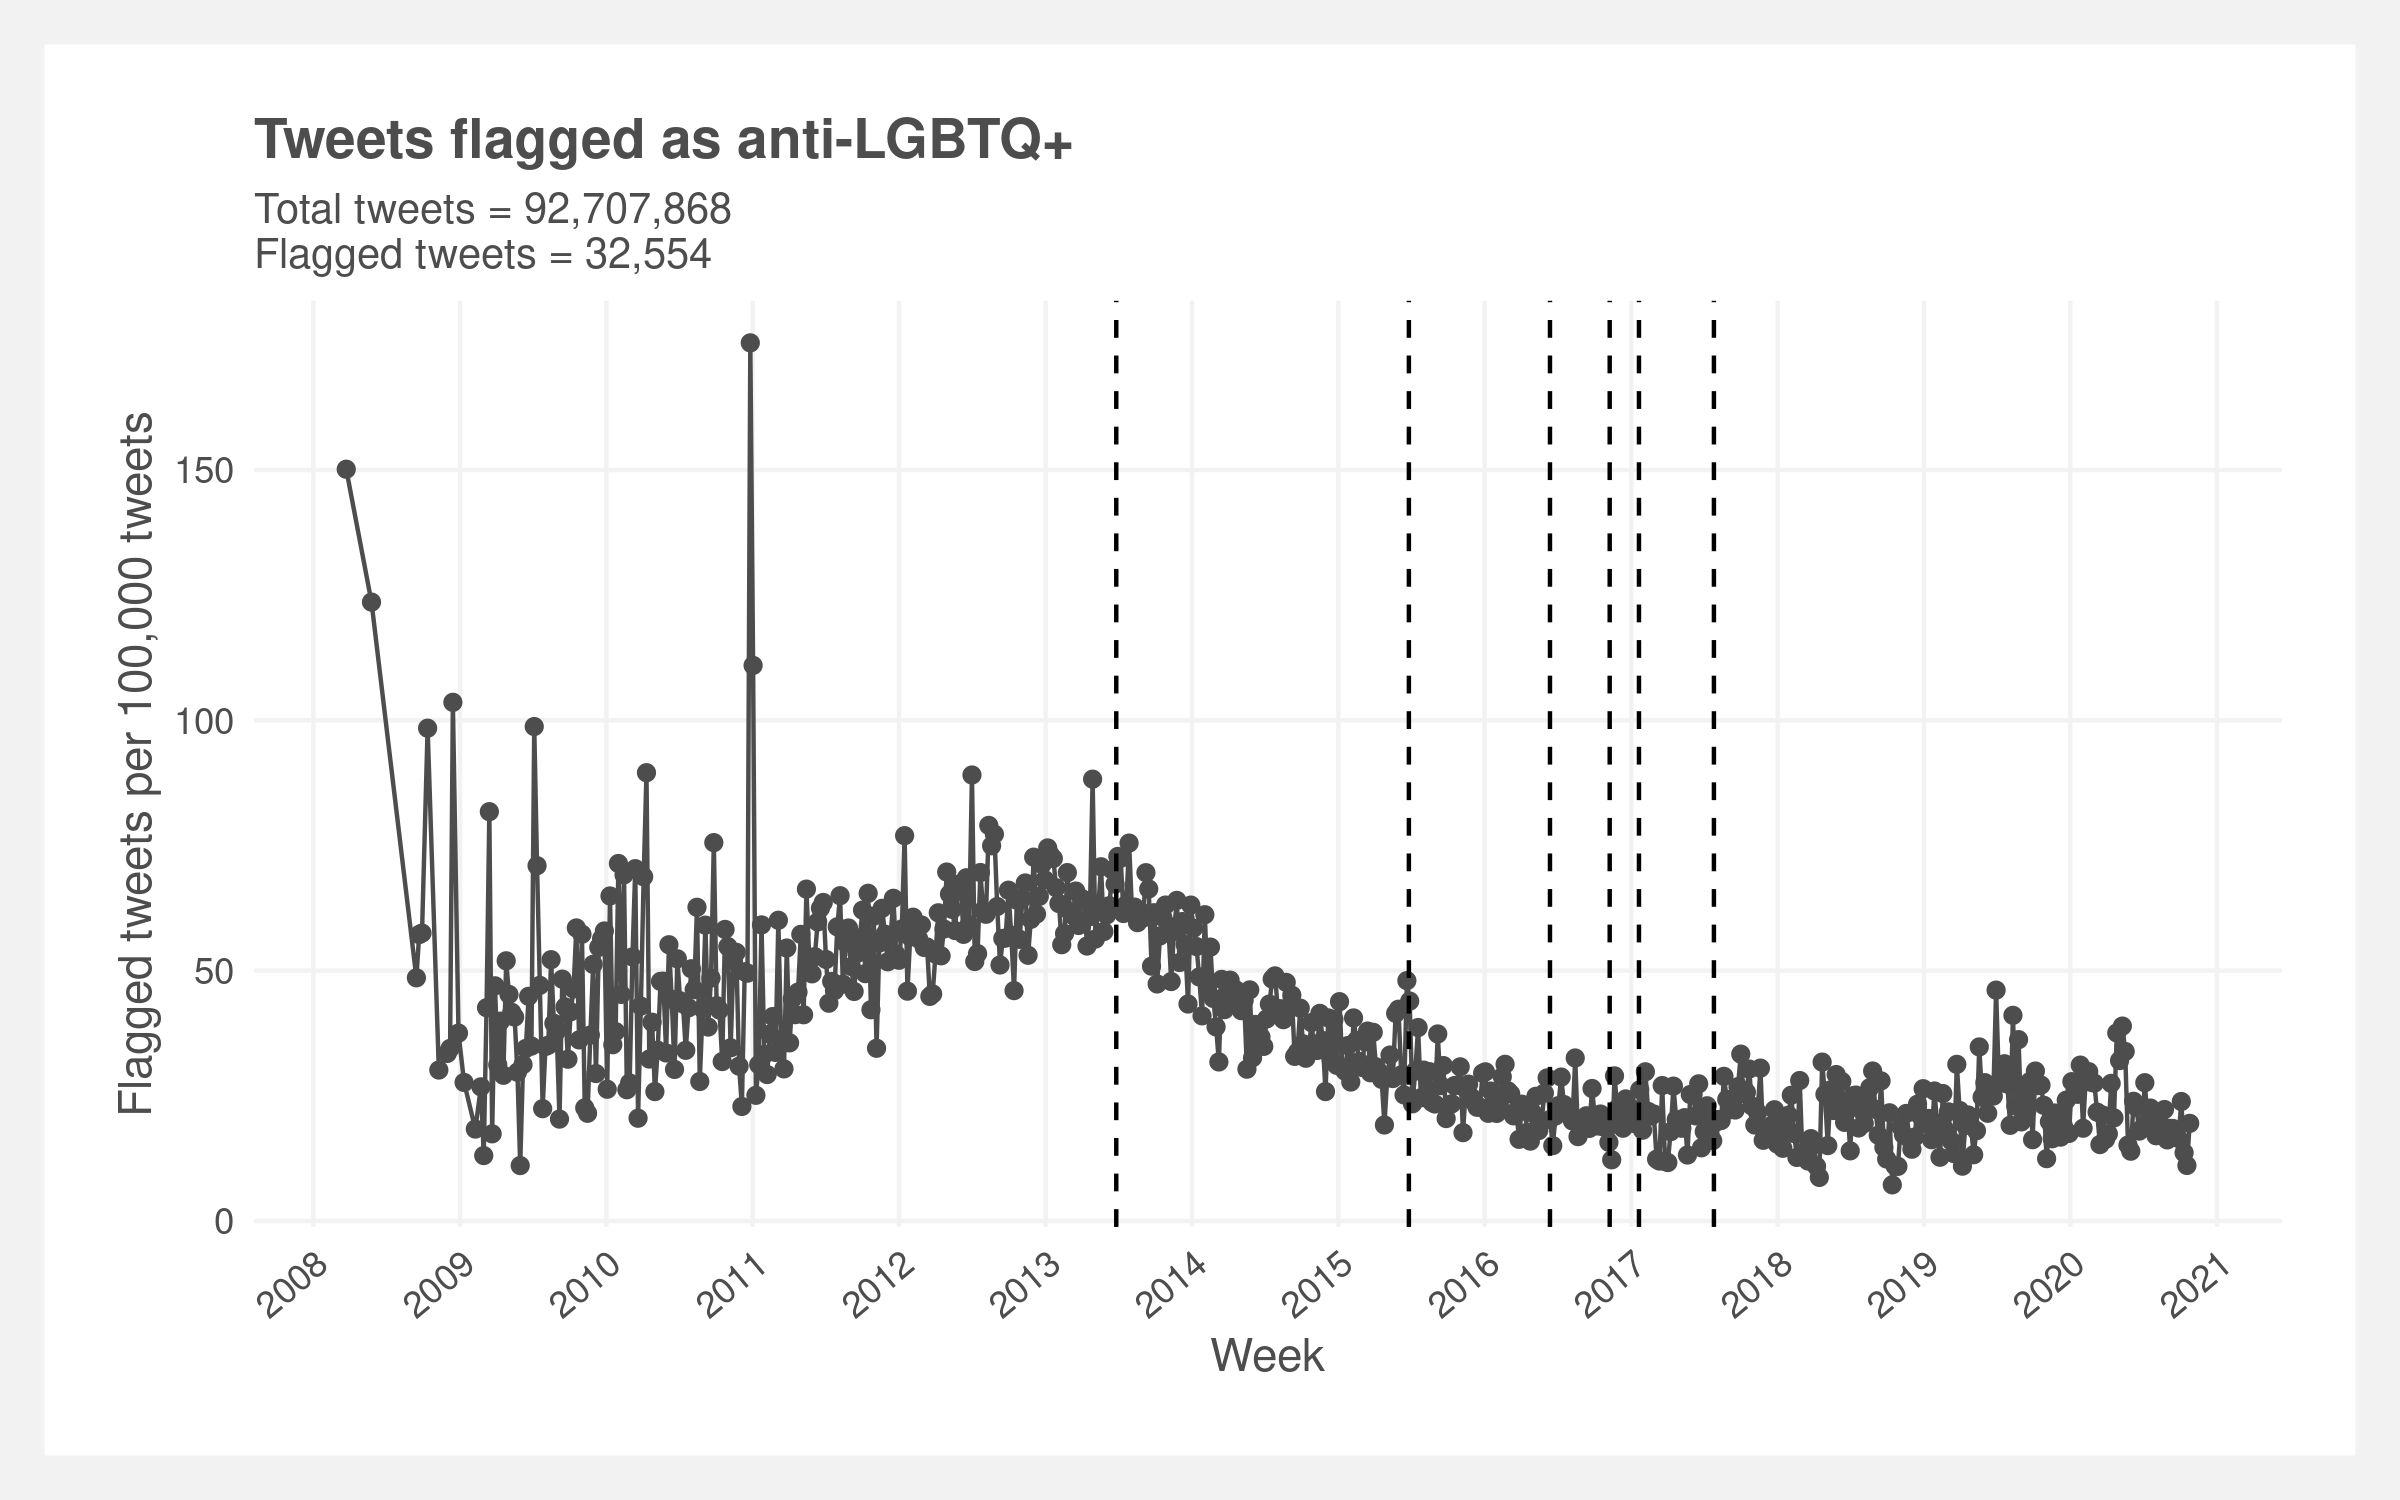
The prevalence rate varies over time, generally increasing in the early years of Twitter and then decreasing post 2013 (below plot). There is a significant amount of noise in the early years which we believe is driven by the relatively small sample size. There’s a clear inflection point in the rate in mid 2013. The rate increases up until then and then monotonically decreases reaching apparent stability around 2017. Visually, there appears to be local upticks in the rate in mid 2015, mid 2019, and mid 2020. The vertical dashed lines represent the six key dates of interest.
The inflection point in mid 2013 is the most visually evident trend. Two other dates also show local changes in the prevalence rate: mid 2015 (legalization of same-sex marriage) and mid 2017 (transgender ban).
Analysis
Changes in anti-LGBTQ+ language after the identified time-points are quantified through changes in prevalence and incidence. Prevalence reflects shifts immediately following one of the identified events, while incidence quantifies changes in rate of anti-LGBTQ+ tweets over time.
We used a regression discontinuity design (RDD) to measure changes in the prevalence of anti-LGBTQ+ tweets immediately after each of the six time points. Shown below, an RDD model fits local regressions to each side of an established cut point. For each of the six models, the date of the event serves as the established cutpoint, T refers to a binary variable representing data points either before or after the event of interest while r represents how far a respective data point is from the established cut point, prior to fitting each model r is centered such that 𝛽Ti represented the effect.
$$Y = \alpha + \beta_0 T_i + \beta_1 * r_i + \epsilon_i$$Each of six RDD models tests for difference immediately prior to and after the identified events, however, this approach can not test changes in the rate of anti-LGBTQ+ tweets. To test changes in incidence we used an interrupted time series design. Shown below, the interrupted time series design includes variable 𝛽time*event tests the rate of anti-LGBTQ+ tweets changes following the identified event.
$$Y = \alpha + \beta_{T_i} + \beta_{event} + \beta_{T_i} * \beta_{event} + \epsilon_i$$Both of these models require specifying a bandwidth of data points to include in the analyses. We used the R package rdrobust to select bandwidth via cross validation. The relevant coefficients testing incidence and prevalence for each of the six events are shown in the below plot. The Bonferroni adjustment was applied to all p values and confidence intervals to control for multiple testing and maintain a significance threshold of 0.05.
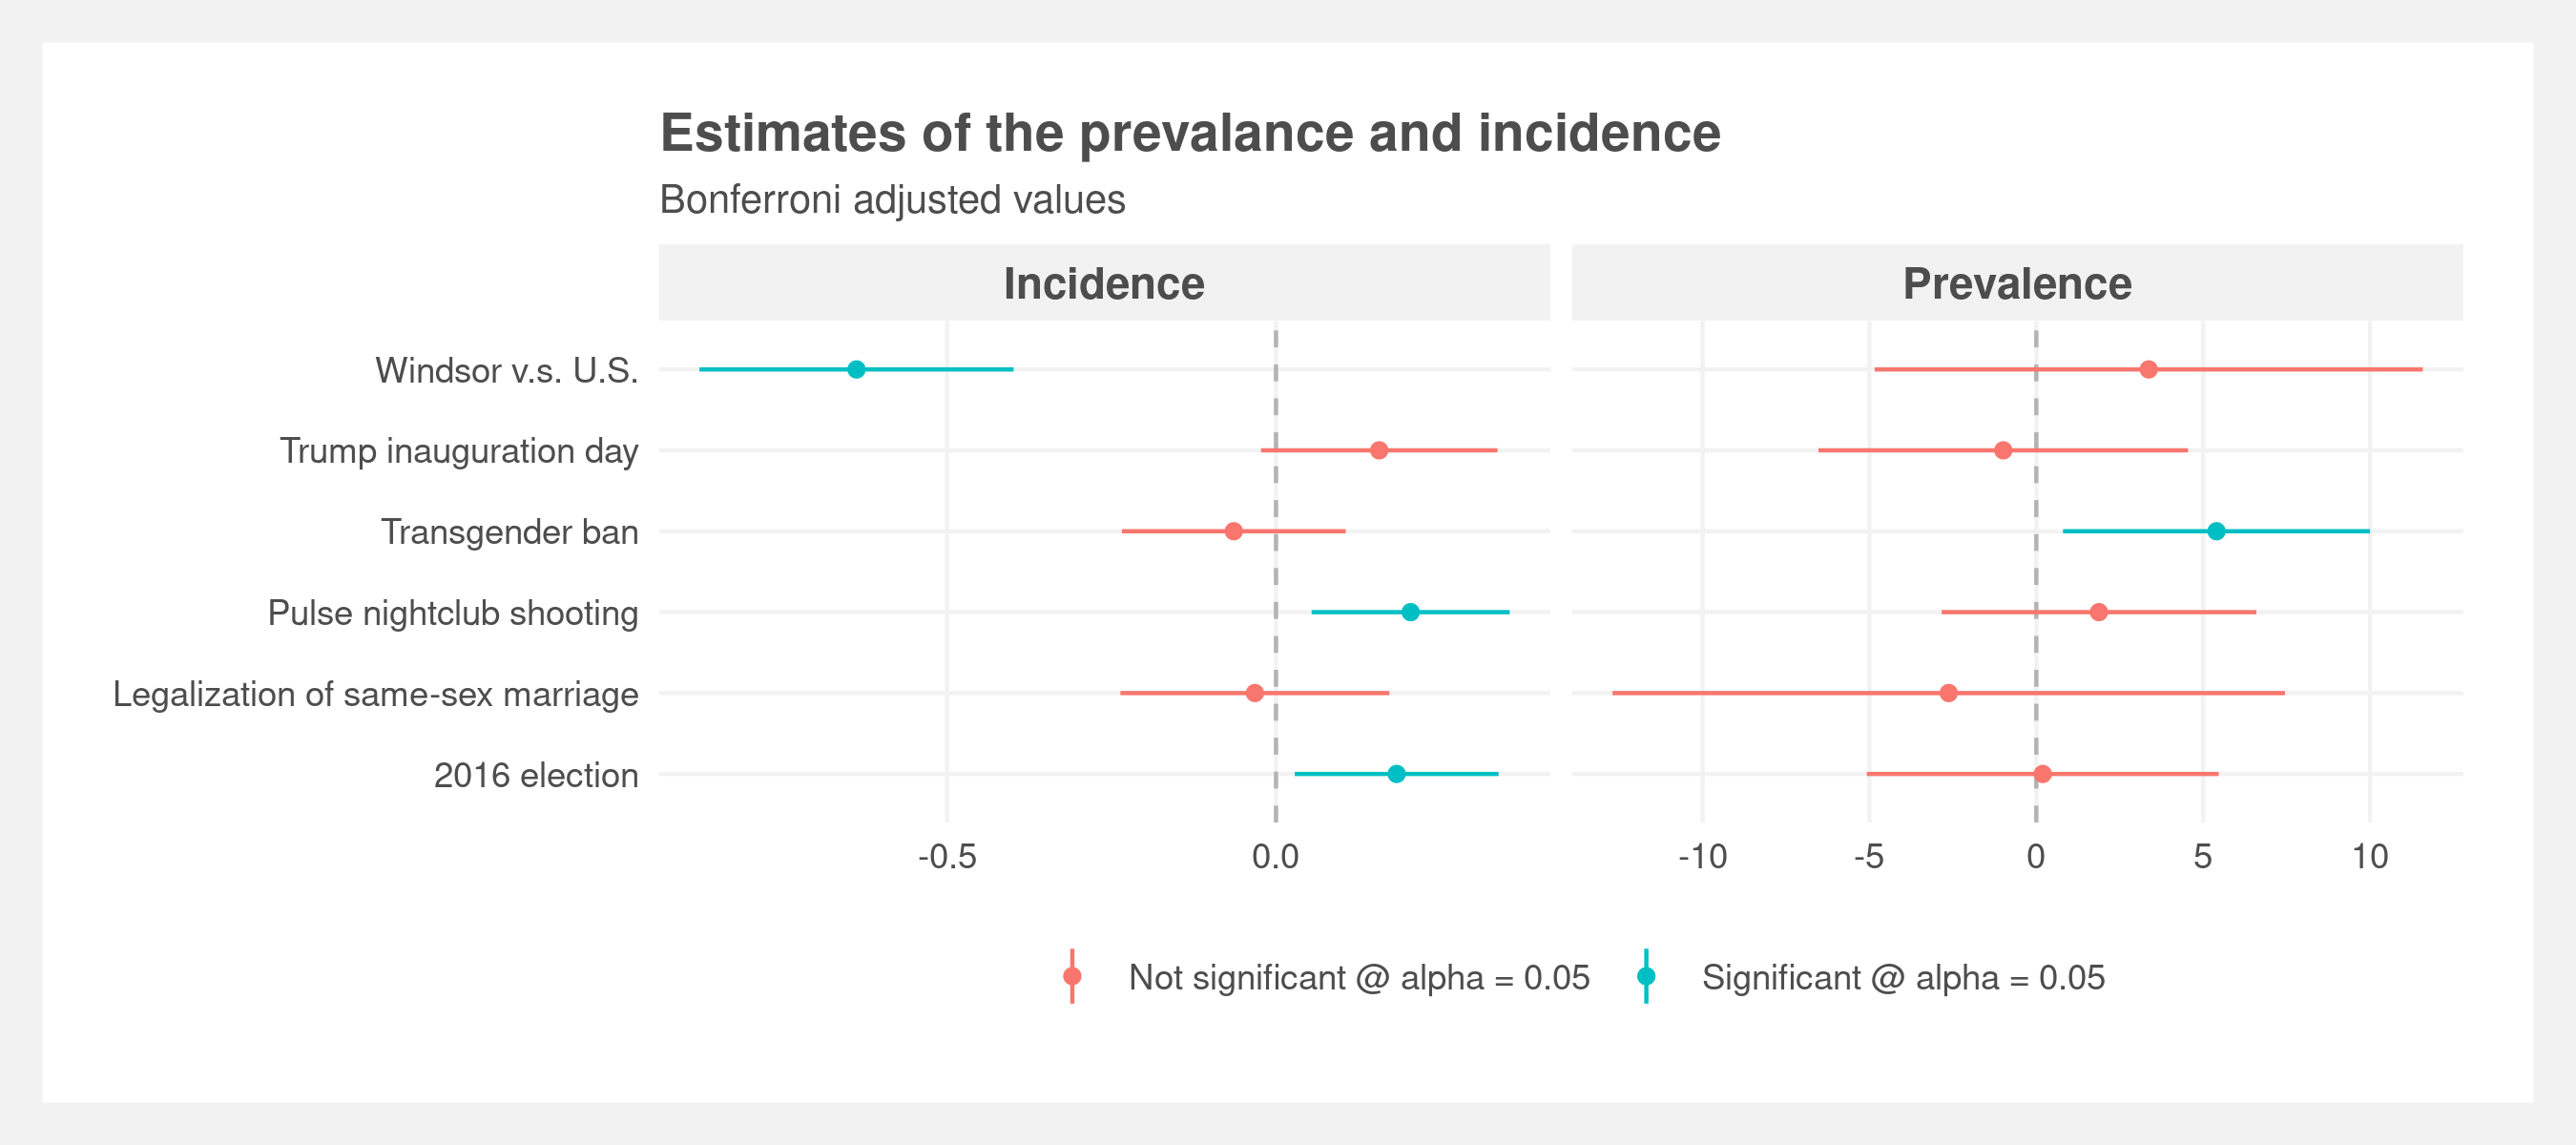
These same measures of incidence and prevalence are visualized in the below plot. Incidence is represented by the change in slopes of the regression lines and prevalence by the gap between the two regression lines at the date of interest.
Discussion
We initially hypothesized that patterns in anti-LGBTQ+ language would follow the results of the CSMaP findings on the prevalence and incidence of white-nationalist rhetoric following the 2016 presidential election. Contrary to expectations, the findings reported here contrast the predicted immediate blip followed by a return to baseline. Only a single event, the announcement of the transgender military ban, coincided with an immediate jump in the prevelance of anti-LGBTQ+ language. The remaining five events did not have any visible change immediately around the event.
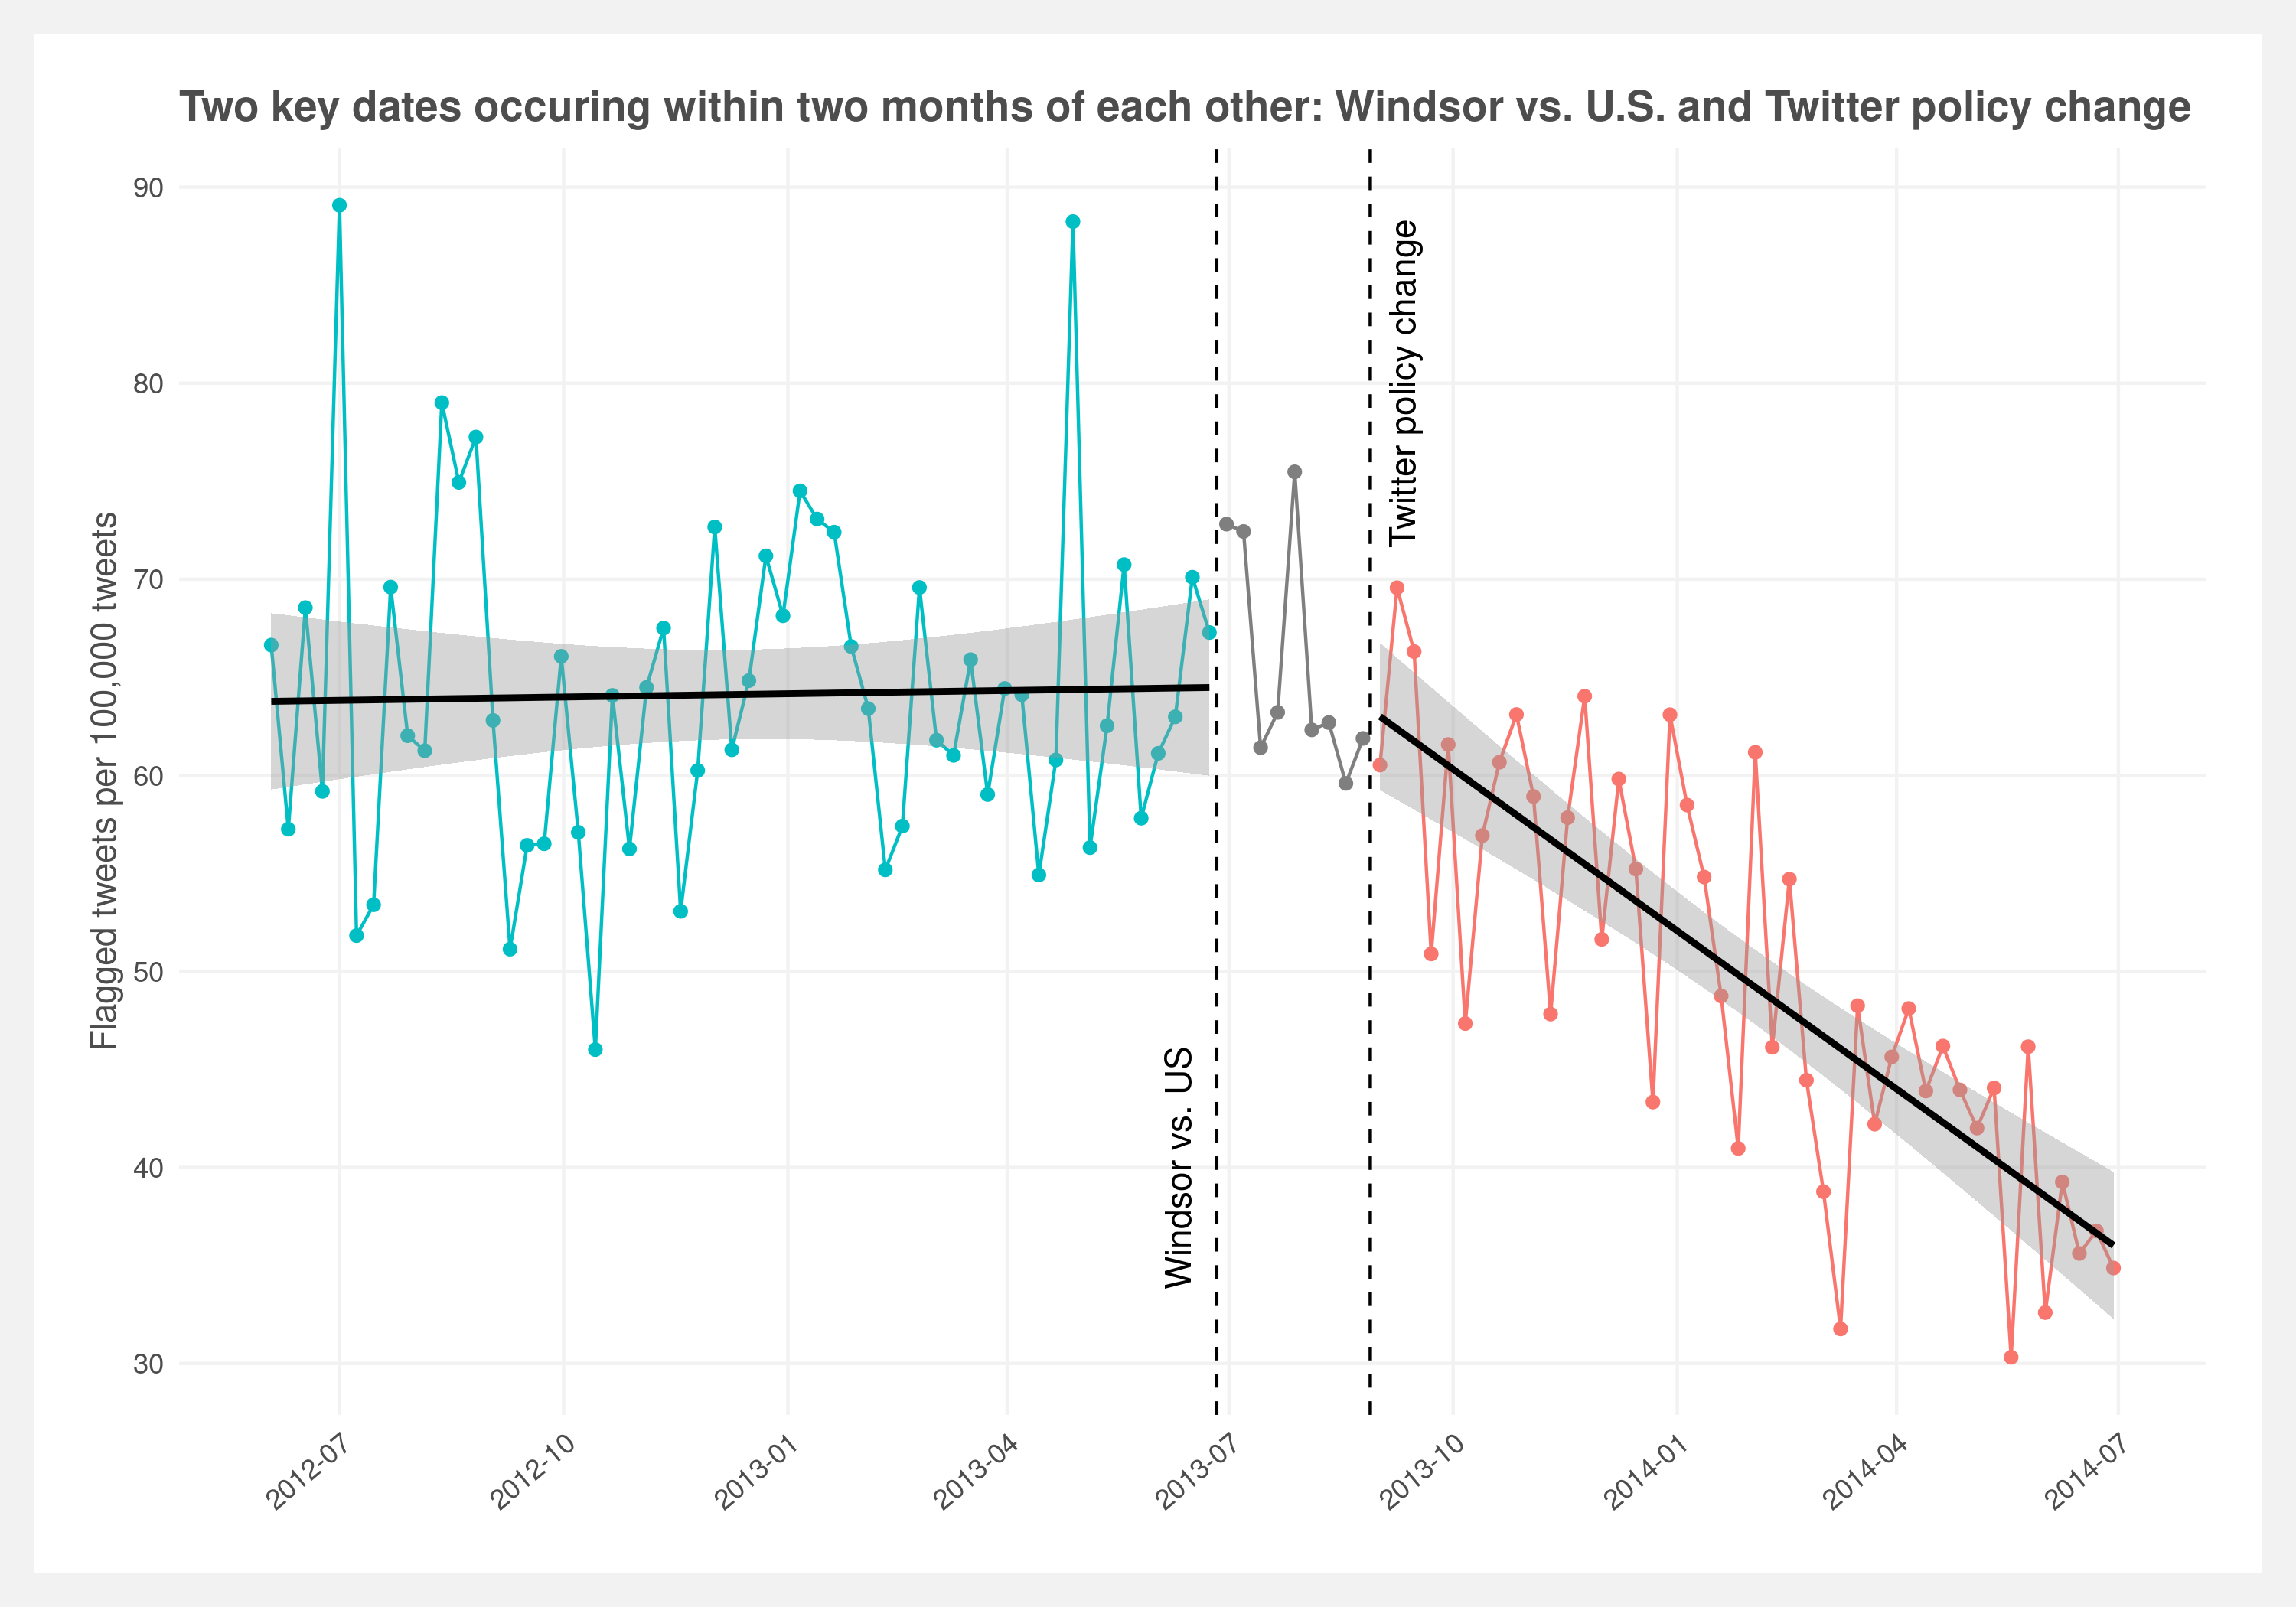
The most salient shift in LGBTQ+ language occurs midway through 2013, this point is the beginning of a consistent and gradual reduction in anti-LGBTQ+ language that culminates with a leveling off midway through 2016. Notably, this sharp reduction in the incidence of anti-LGBTQ+ language coincided with the Windsor vs United States court case. To understand other competing explanations for this sudden shift, we investigate other events that occurred in the same window of time. Investigating potential confounders revealed that in August of 2013, Twitter announced a change in policy allowing users to flag tweets that they found offensive. While the policy was announced in late August of 2013, the implementation was gradual.
Shown in the below plot, the implementation of the new policy aligns with clear reduction in anti-LGBTQ+ language. Space between the decision of Windsor vs U.S. suggests a constant level of anti-LGBTQ+ speech that only begins to change following the introduction of the novel Twitter policy. This realization adds further skepticism to the observed changes in slope for the two events occurring in 2016. Skeptical priors suggest that the incidence in anti-LGBTQ+ tweets was already reducing and reached a new natural baseline around 2016 after the policy has been universally implemented.
Final thoughts
We were able to detect noticeable trends in the occurrence of anti-LGBTQ+ tweets. Originally, this research aimed to investigate the relationship between divisive political events relevant to the LGBTQ+ community and the occurrence of increased anti-LGBTQ+ language on a popular social media site. An unexpected finding was the potential impact of a Twitter policy change that coincided with a noticeable reduction in the incidence of offensive tweets targeted at the LGBTQ+ community.
Future research aims to expand this exploratory finding by rigorously testing the policy implications of allowing users to report posts they find offensive in nature. This research will also aim to implement improved methodologies by expanding the content dictionary of hate speech and develop a more comprehensive code book to label training tweets for machine learning classifiers. As described, the content dictionary used as the first step of identifying anti-LGBTQ+ tweets was based only off of Hatebase. A more expansive content dictionary could be created by including language obtained from known sources of anti-LGBTQ+ content such as the message board 4chan or known anti-LGBTQ+ Reddit communities. When coding screened tweets, explicitly separating clear hate speech from ambiguous cases such as colloquial slurs. Moreover, limiting analysis to users who have had a history of posting at least one instance of anti-LGBTQ+ content may reduce variance in the baseline prevalence of anti-LGBTQ+ language and allow for precise statistical analyses. This approach would examine the effect of Twitter policy and political events on a subset of users with a demonstrated propensity to using anti-LGBTQ+ language.
Future analysis could also allow for more precise estimates. The current study only used a single model to classify tweets identified from the content dictionary screener. While we only used predictions from the RNN in this study, continuing work aims to test the potential of ensemble models that combine the predictions of several different models. Such ensemble methods aim to leverage the different strengths of separate classifiers to produce predictions that are more robust than those of a single model. After classifying tweets, more advanced models can be used to quantify patterns in the incidence and prevalence of tweets that are harmful to the LGBTQ+ community. ARIMA methods and Bayesian time-series models present an alternative method to quantify changes in a more noise tolerant manner compared to the RDD and interrupted time series designs used in the present report.
Read the full paper including the limitations of this research here.
2020 December
Find the code here: github.com/joemarlo/hate-speech