Tips for building complex Shiny applications
Programming tips for statisticians
Shiny is one of the best ways to build interactive web apps. It leverages R to run data analysis and provides an interface to interact with the traditional web languages Javascript, CSS, and HTML. There’s a strong online community providing assistance, however there are a few Shiny tips I wish I had known before I recently embarked on creating a complex Shiny app myself.
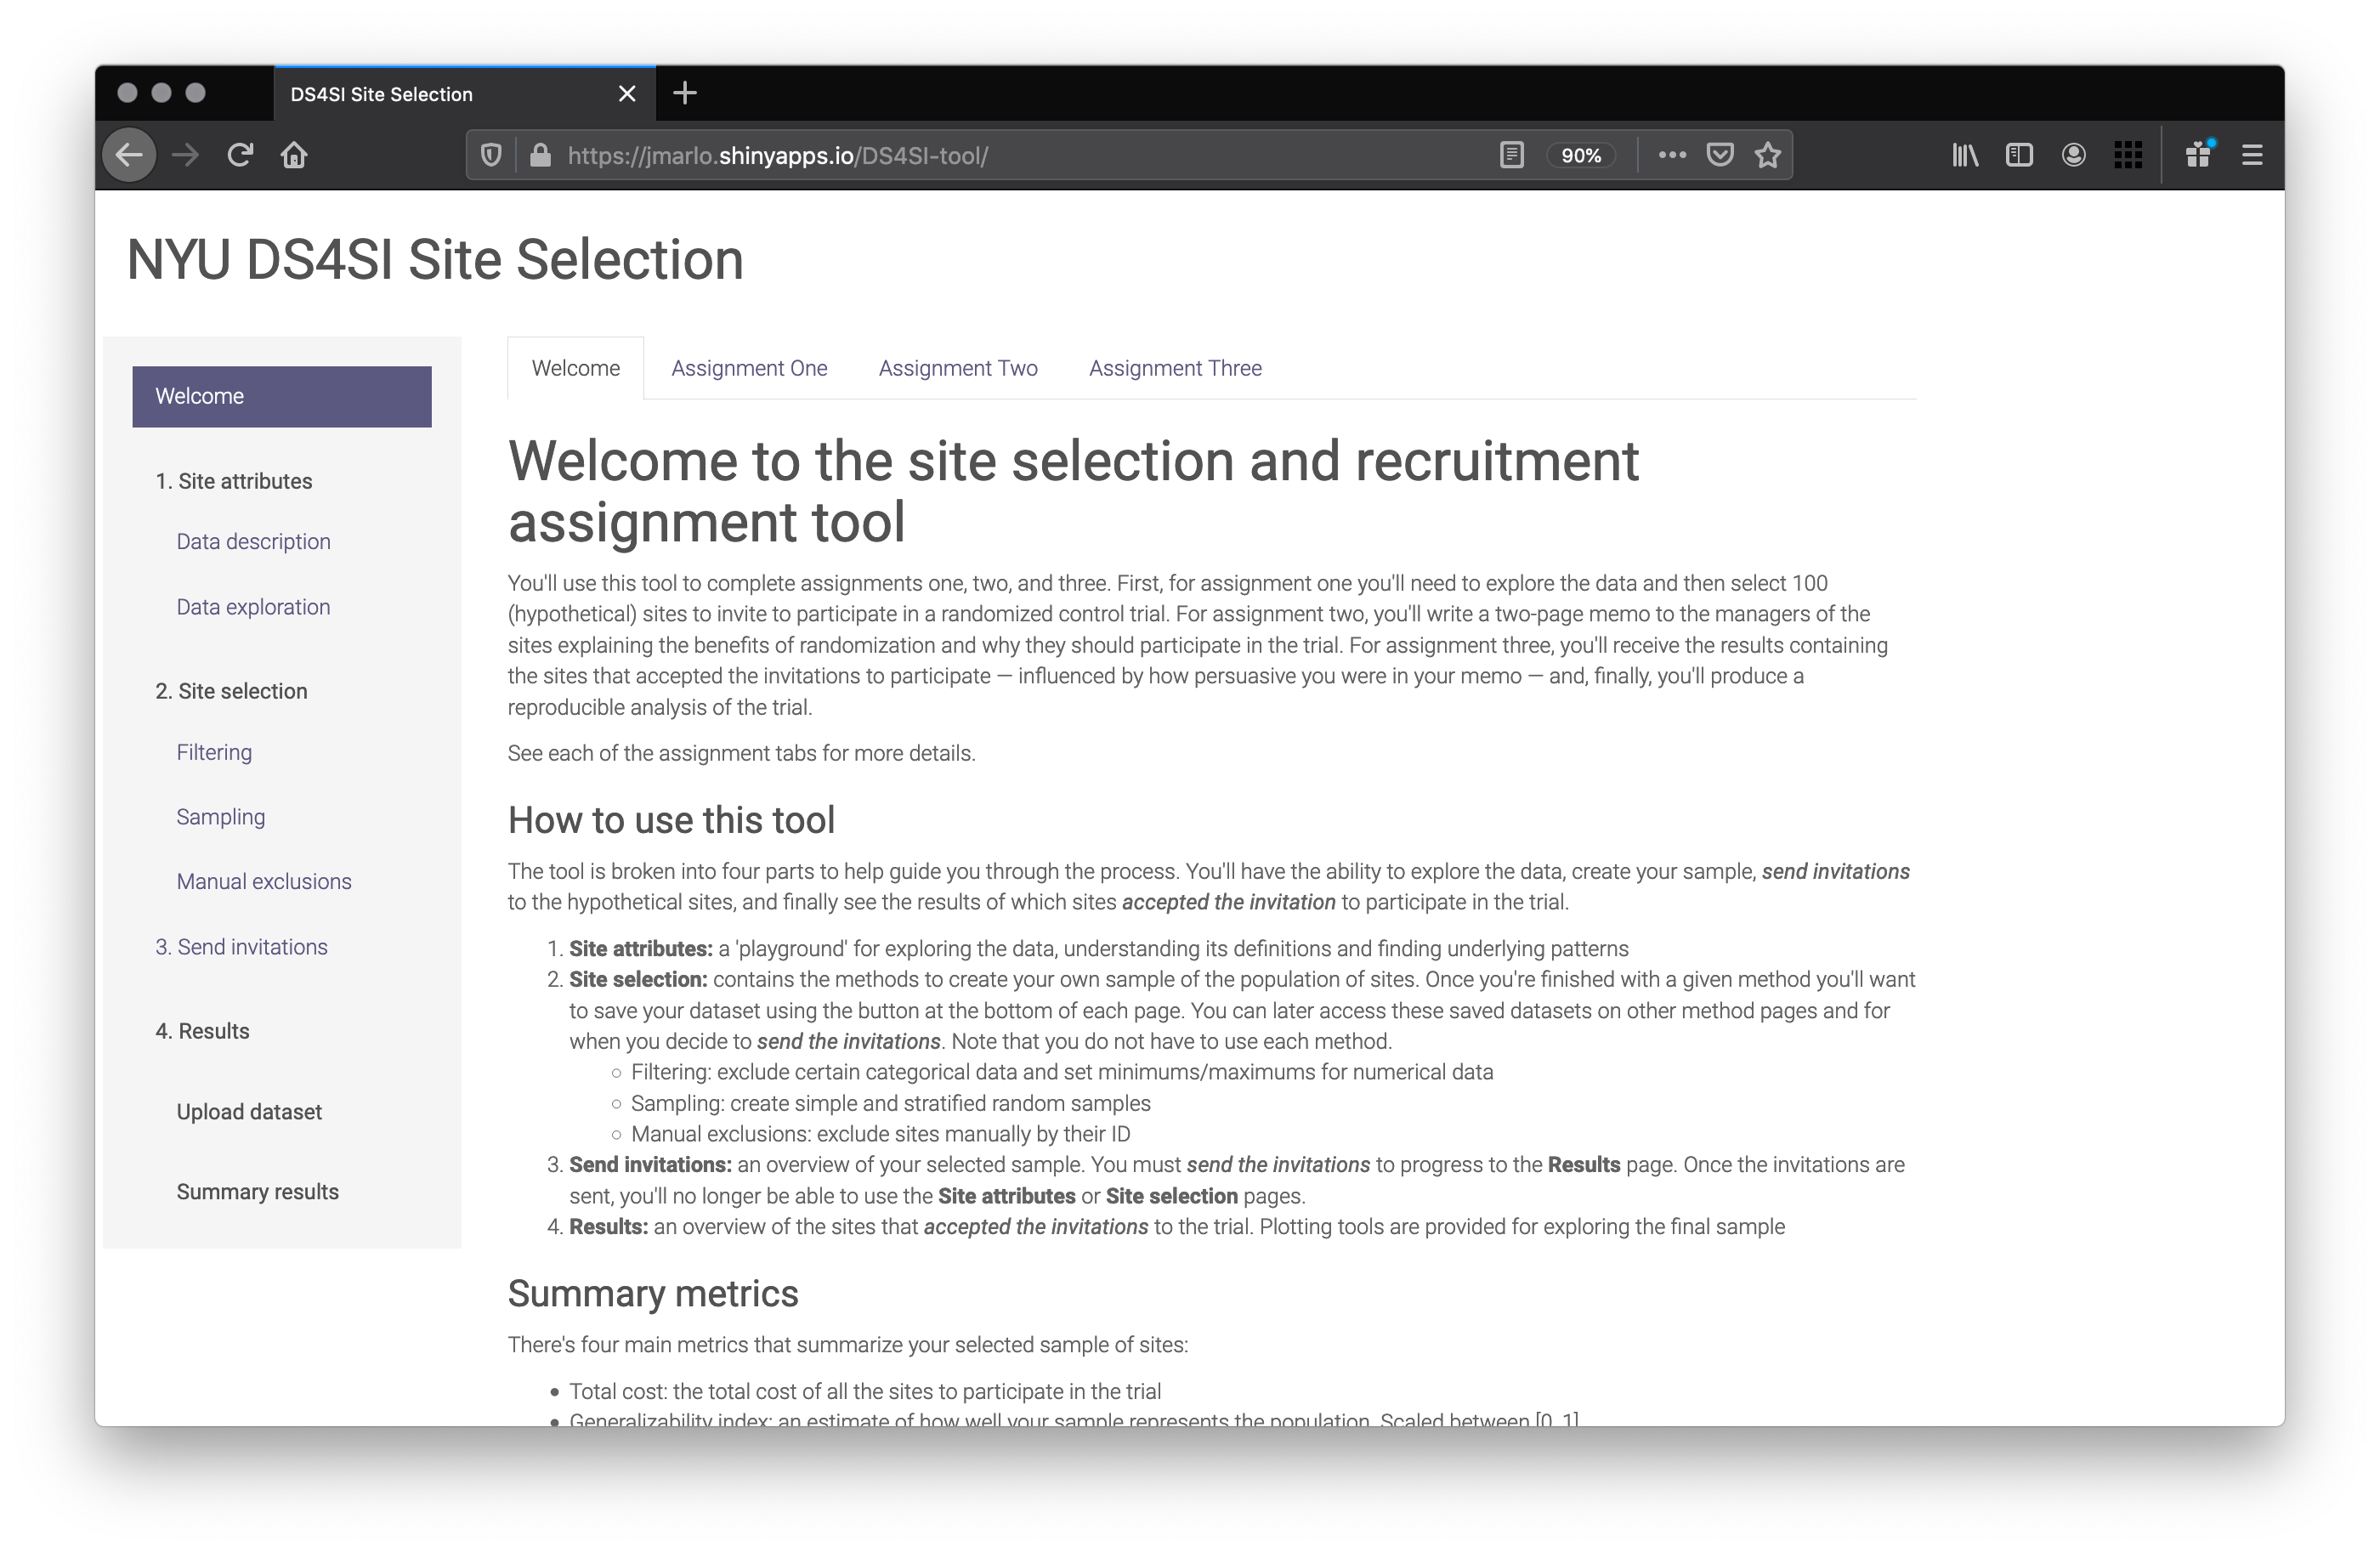
In conjunction with Dr. Jennifer Hill, I’ve been using Shiny to build a pedagogical tool that teaches students the tradeoffs that need to be weighed and made when designing randomized control trials. The tool follows a choose-your-own-adventure theme guiding the students through data exploring, plotting, and slicing-and-dicing via filtering and random sampling to ultimately create a sample of locations to invite to a hypothetical randomized control trial. To engage students in the process and provide real time feedback, the locations then accept or decline the invitation — randomly determined with R’s rbinom() with probability defined by a predetermined metric for each location combined with how persuasive they were in writing a memo to the location managers.
The tool's landing page
This, as it turns out, was a quite complex project, and with the benefit of hindsight, these are the Shiny programming tips that would have helped me and hopefully can help you.
reactiveValues() and reactiveValuesToList()
The tool allows students to modify data via filtering, random sampling, stratified sampling, and manually removing outliers. Since there are multiple methods there needs to be an ability to save datasets in one method and then load the data within another method. Additionally, we encourage the students to experiment with different sampling designs so there shouldn’t be a practical limit to the amount of datasets saved.
Shiny has a reactive framework which can be disorienting to those coming from the linear scripting world of R, MATLAB, and the like. In a typical R script you can create an object simply by my_object <- 5 or create a list object by my_list <- list() and then add objects to that list by my_list <- c(5, my_list). The reactive context makes this more difficult as the user could add any number of items to the list in a non-linear fashion.
Shiny provides a function for this behavior. reactiveValues() can be used on the server side of the Shiny app and used to store objects. In my case, I needed to save datasets and their respective names, which are determined by the user.
# initialize list of saved datasets
datasets_available <- reactiveValues(data = NULL, data_names = NULL)

# append the user data as a new sublist to the master list of saved data
datasets_available$data <- c(datasets_available$data, list(dataset_to_save))

# add input string to list of dataset names
datasets_available$data_names <- c(datasets_available$data_names, save_name)
dataset_to_save and save_name, in my case, is the dataset object and an input string from the user respectively. However, this could be inputs or other objects in the server-side code. The list datasets_available$data_names can then later be leveraged in a dropdown to display the datasets to the user.
# update dropdown with current list of datasets
updateSelectInput(
  session = session,
  inputId = id,
  choices = datasets_available$data_names
)
And this can be wrapped in an lapply() so multiple instances of dropdowns can be updated across many different pages. See the repo page for the exact code if you’re interested in recreating it.
And finally the user can access their data via a reactive function per each page.
choosen_data <- reactive({
  datasets_available$data[[match(input$selected_data, datasets_available$data_names)]]
})
reactiveValuesToList() is another equivalently helpful function. It’s basic usage is similar to how many people use as.list() however there’s a specific, powerful usage. You can call it on input and get all available reactive values inputted by the user.
# return all reactive values
reactiveValuesToList(input)
You can then subset this to get specific values. For example, you can retrieve a list of the slider values on a page by subsetting using a list of the slider names.
# define slider ids
slider_id_list <- c(“slider_id_one”, “slider_id_two”, “slider_id_three”)

# return a list of the current values for those sliders
reactiveValuesToList(input)[slider_id_list]
Functionize as much code as possible
This should be obvious to experienced coders. There’s the DRY principle in software programming to keep code maintainable. In the Shiny context, I found it even more important than in typical statistical computing. For example, the tool shows the same histograms more than three times across different pages. In this case, a single function can be defined to draw the histogram plot based on inputted data and then be used with various outputs.
# function to create histograms. Saved in functions.R script
draw_histograms <- function(data){
  data %>% ggplot(aes(...)) + geom_hist()
}

# server-side code to draw multiple instances of histograms with different data
output$filtering_plots <- renderPlot(draw_histograms(filtering_data()))
output$sampling_plots <- renderPlot(draw_histograms(sampling_data()))
Code can also be further abstracted using modules which account for namespace issues that functions can’t directly address.
Good naming conventions go a long way
Large Shiny apps are going to have dozens of variables and UI objects. The pedagogical tool has over 120 and it’s easy to lose track of what they represent. I have found a procedural method to naming works best. In this case, following a naming convention of [relevant_page]_[object type]_[name] worked best. For example, invitations_button_send is the send button on the invitations page. The names can become quite long, but trading specificity for brevity is worthwhile when you’re trying to figure what that variable you defined three weeks ago actually represents.
In addition to organization and sanity, this method allows you to easily use mapping functions on objects. For example, you want to update the label on three different buttons scattered across three pages. Simply throw it in a lapply() call and modify the ID within each ‘loop’.
# list of prefixes used for saving related objects
data_save_name_prefixes <- c(
  "filtering_data_save",
  "sampling_data_save",
  "manual_data_save"
)

# update every label on all three save buttons
lapply(data_save_name_prefixes, function(id){
  save_name <- paste0(id, "_name")
  save_button <- paste0(id, "_button")

  # make save button label equal to the inputted dataset name
  observeEvent(input[[save_name]], {
    updateActionButton(
      session = session,
      inputId = save_button,
      label = paste0("Save ", str_trim(input[[save_name]]))
    )
  })
})
Don’t always think in if then statements
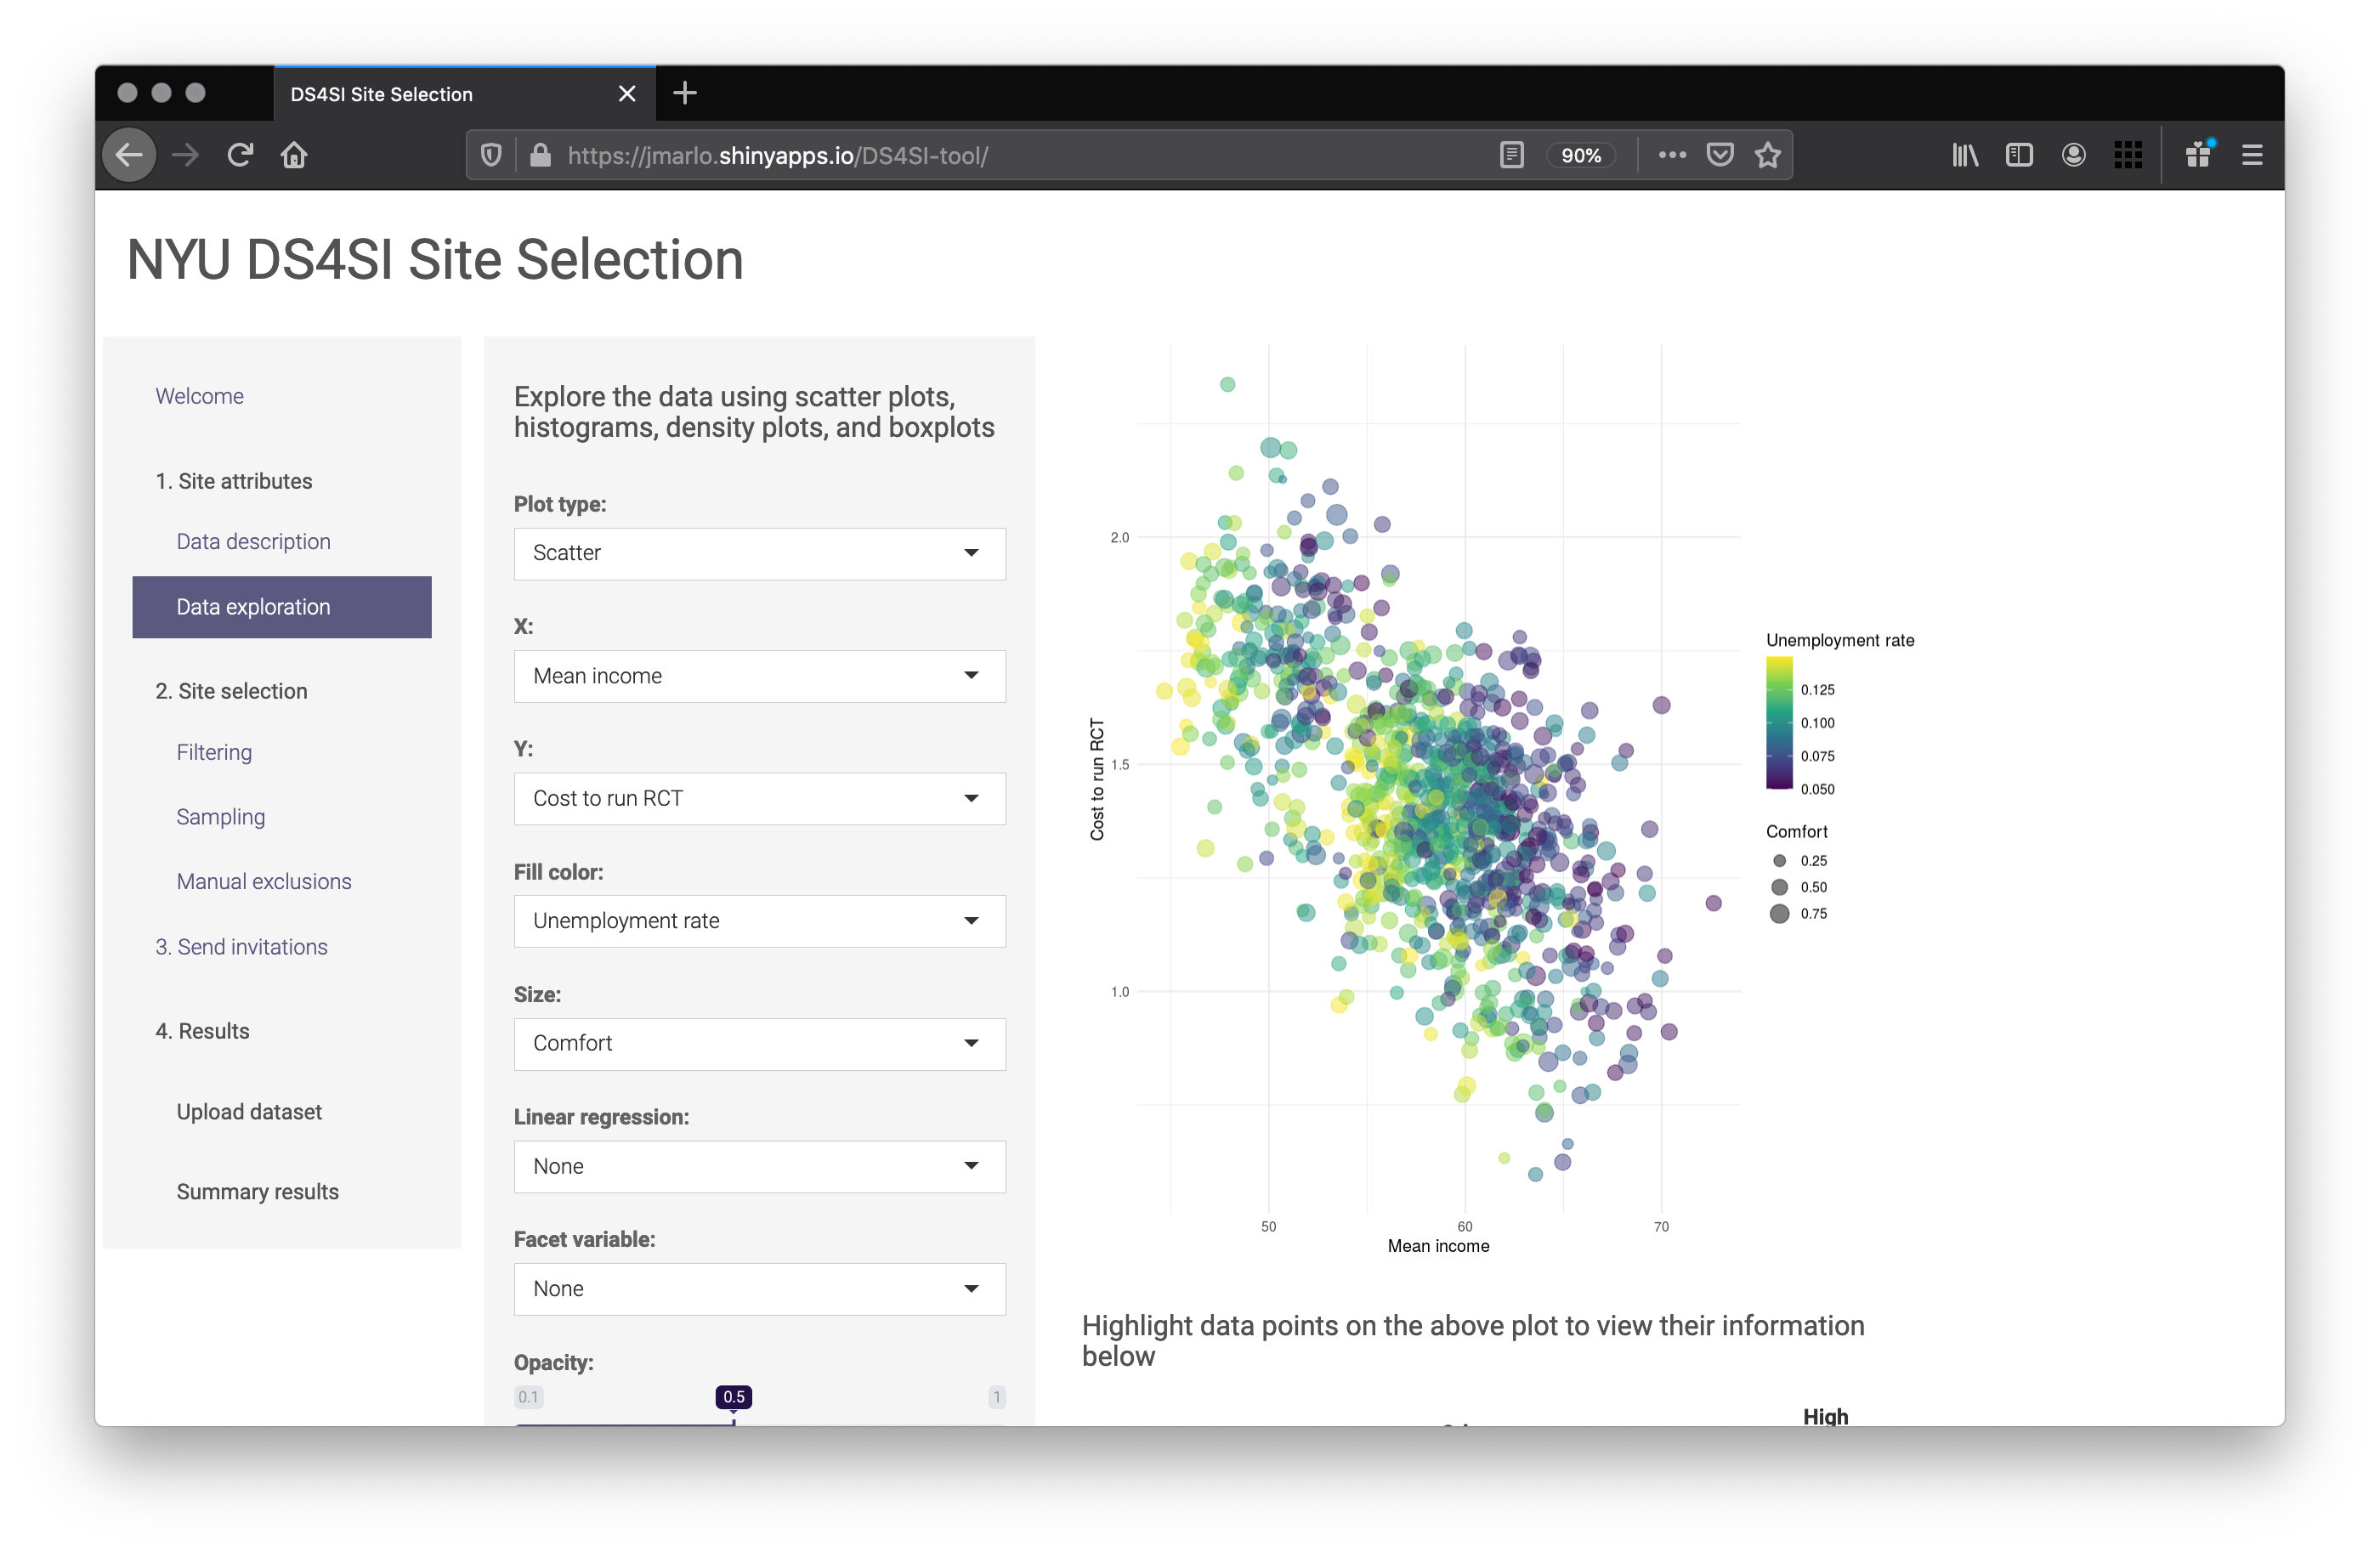
It’s easy to fall into the if then death spiral of nested statements to account for every scenario a user may go down. I found it simpler to manage the user interface and build objects as they go. For example, on the Data exploration page of the tool the user can build their own plots. It’s all driven by ggplot2 and leverages the layering mechanism to selectively modify the final plot.

The Data exploration page containing the ggplot output
On the UI side, the code only shows the inputs available for the type of selected plot. And on the server side, the code leverages few if then statements build up a ggplot object. Here’s a simplified version. The full version with all the various plot types can be found here.
# create base ggplot object
p <- ggplot(plot_data, aes_string(x = input$exploration_variable_x))

# if the user selects scatter
if (input$exploration_select_plot_type == 'Scatter'){
p <- p + geom_point(aes_string(...)

      # add regression line
      if (input$exploration_variable_regression == 'Include'){
            p <- p + geom_smooth(aes_string(...))
      }
}

# if the user selects histogram
if (input$exploration_select_plot_type == 'Histogram'){
      p <- p + geom_histogram(...)
    }
This is much more concise than writing plot functions for each plot type, accounting for each combination of grouping, fill color, facetting, etc. The combinatorics become exorbitant.
Similarly, this mindset is helpful when rendering dependent UI elements. The tool allows stratified sampling on one or two variables. Each of these require an independent slider to determine the sample size per stratum, and they have to be rendered in real time as there are 28 possible sliders and most are not relevant to a user for a given selection. Instead of nesting if then statements to select which sliders to show, the sliders can be determined by tallying the combinations of slider variables and then mapping over those combinations to create a slider per each. Full code here.
# table of strata combinations that exist for the selected dataset and strata input variables
strata_combos <- reactive({

  # create vector of the pairwise variable names
  # this method works even if one or two input$strata_variables are entered
  name_combos <- Reduce(
    x = data[, input$strata_variables],
    f = function(var1, var2) paste(var1, var2, sep = "_")
  )

  # tally the names
  strata_combos <- as.data.frame(table(name_combos))

  return(strata_combos)
})

# generate sliders for each strata combinations
output$sampling_strata_sliders <- renderUI({
  tagList(
    pmap(.l = strata_combos(),
         .f = function(...) {
           sliderInput(...)
    })
  )
})
Folder structure
And finally, for large Shiny apps such as this tool, it’s important to organize the files in a split file structure rather than the typical app.R single file structure. Shiny knows to automatically load server.R, ui.R, and global.R in the base directory and to load everything in the /R subfolder (think of files saved here as automatically being source()‘ed). The /www folder is also special; it contains typical web code such as CSS (and JavaScript if you have some) and is similarly automatically loaded. Custom subfolders like /markdowns need to be loaded directly by the ui.R script.
- /DS4SI-tool
- server.R
- ui.R
- global.R
- /R
- functions.R
- ggplot-settings.R
- /markdowns
- /www
2020 August
Find the code here: github.com/joemarlo/DS4SI-tool
